The Question
Act I
Does gaining legal access to alcohol make young people more likely to die?
In the United States, the minimum legal drinking age (MLDA) is 21.
Should it be lower? If legal access raises deaths, a birthday rule is a life-and-death policy lever.
Rigid rules look like the enemy of experiments — yet they create one
- A bureaucratic cutoff seems to leave nothing to chance
- But someone aged 20 years and 11 months is a near twin of someone aged 21 and 1 month
- Only one of them may legally buy a drink
Near the line, the rule — not the person — decides who is treated.
Monthly death rates step up right at the 21st birthday
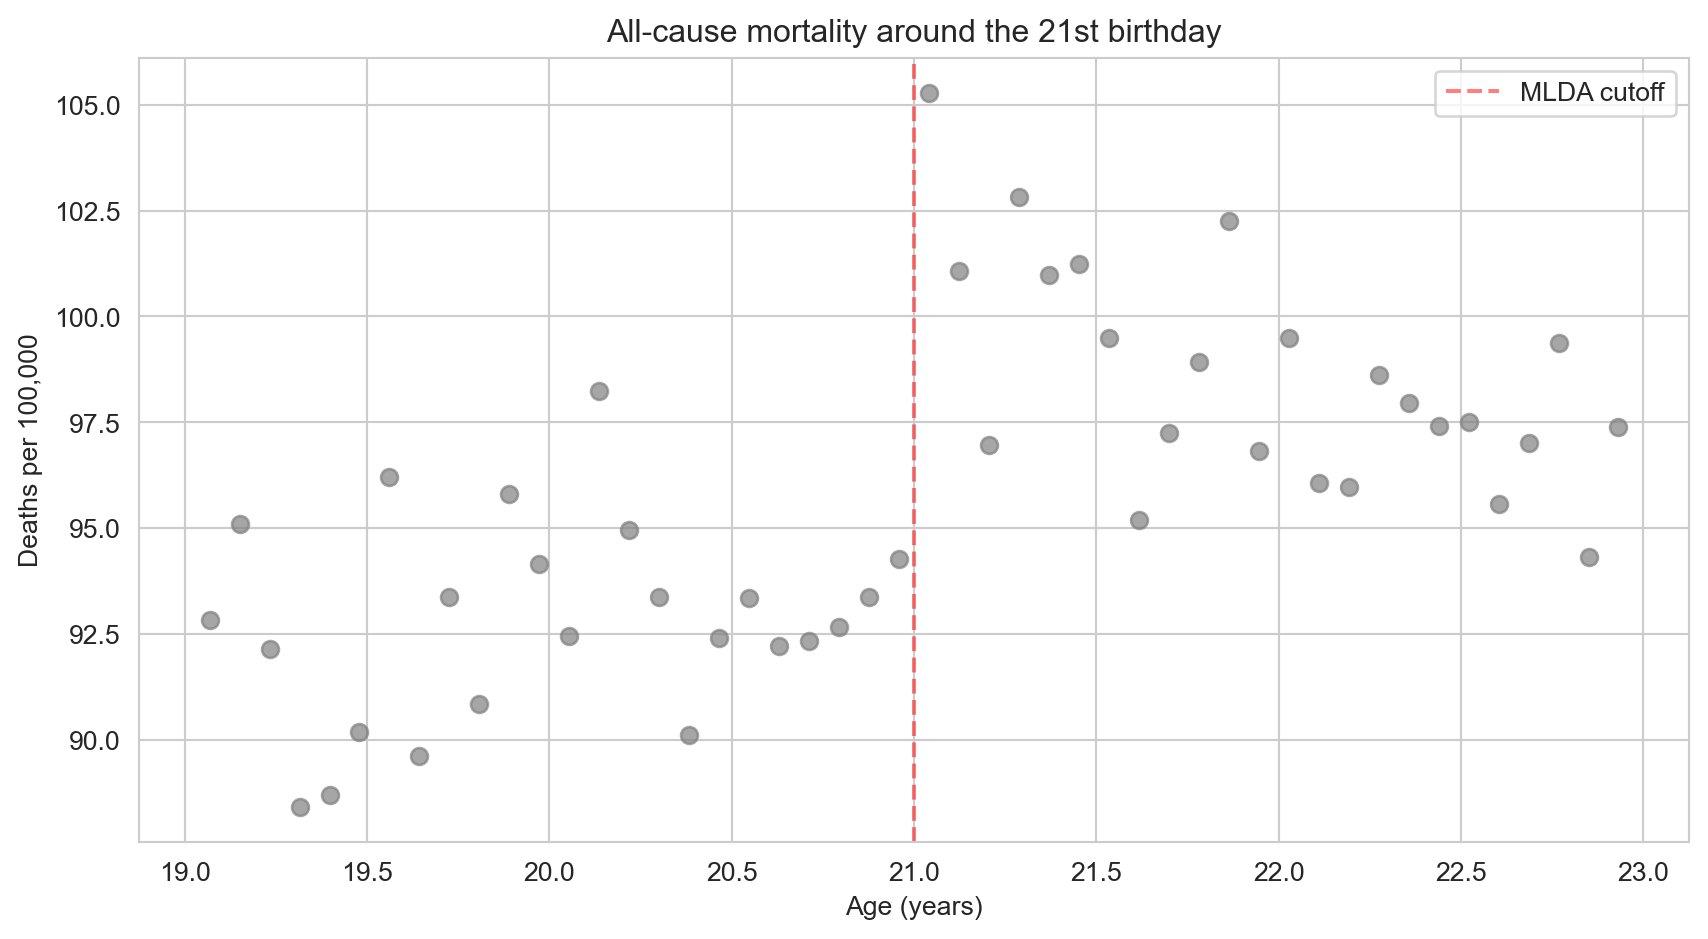
All-cause deaths per 100,000, one dot per monthly age cell; the dashed line marks age 21.
Our route through the chapter
- The question — how a birthday rule can act like a natural experiment
- The investigation — the sharp RD design and regression; the MLDA mortality case study; robustness checks; fuzzy RD and Boston’s exam schools
- The resolution — what RD can and cannot claim, and the traps to avoid
Three ingredients define every RD design
Running variable
The continuous score that decides treatment — here, age \(a\).
Cutoff
The value where treatment switches — here, 21.
Treatment indicator
\(D_a = 1\) at or above the cutoff, \(0\) below it.
Name these three and you have described the design.
Four more words we will use all lecture
| Term | Plain meaning |
|---|---|
| Sharp vs. fuzzy RD | Treatment flips fully at the cutoff vs. only its probability jumps |
| Continuity assumption | Without treatment, outcomes would pass smoothly through the cutoff |
| Bandwidth | How far from the cutoff we let the data reach |
| Placebo test | Check an outcome that should not jump — it must stay flat |
Sharp/fuzzy says how treatment moves; the other three keep the jump honest.
The Investigation
Act II
At the cutoff, drinkers and non-drinkers never share an age
| Age | Legal access to alcohol |
|---|---|
| 20 years, 11 months | 0% |
| 21 years, 0 months | 100% |
There is no age at which we can compare treated and untreated people side by side.
RD has no overlap — so it cannot work by matching people with the same age.
RD does not “control for” age — it extrapolates each side to the line
Regression with controls
- Compare treated and untreated at the same value of a control
- Needs both groups at every value
Regression discontinuity
- Fit the trend separately on each side
- Project both trends to 21 and read the gap
Because RD extrapolates, the shape of the fitted trend matters.
A birthday flips legal access from 0 to 1
\[D_a = \begin{cases} 1 & \text{if } a \geq 21 \\ 0 & \text{if } a < 21 \end{cases}\]
\(a\) is age (the running variable, agecell); \(D_a\) is the treatment switch (over21).
Treatment is a deterministic function of age: no exceptions, no choice — a sharp RD.
Age shapes death rates smoothly; only legal access can jump at 21
Age has a smooth path to mortality; the legal-access path is the only one that can create a break.
Continuity: without the policy, mortality would glide through 21
- Every other influence on death rates changes smoothly with age
- So the outcome trend, absent treatment, has no break at 21
- Any break we see must come from the treatment
A speed bump on a smooth road means someone put it there.
Plot first: a scatter with a line at 21 shows the jump before any model
import pandas as pd                       # pandas → load tables
import matplotlib.pyplot as plt           # matplotlib → draw the scatter

# every course dataset lives in the repo's data/ folder on GitHub
GITHUB_DATA_URL = "https://raw.githubusercontent.com/cmg777/intro2causal/main/data/"
mlda = pd.read_csv(GITHUB_DATA_URL + "ch4/mlda_clean.csv")   # monthly age cells

fig, ax = plt.subplots(figsize=(8, 4.5))                      # one blank panel
ax.scatter(mlda["agecell"], mlda["all"], color="gray")        # death rate vs. age
ax.axvline(21, color="red", linestyle="--")                   # mark the cutoff
plt.show() # the step at 21 appearsOne regression measures the jump while holding the age trend fixed
\[M_a = \alpha + \rho \, D_a + \gamma \, a + e_a\]
- \(\rho\) = jump at the cutoff — the causal effect
- \(\gamma\) = the smooth age trend
- \(M_a\) = death rate (
all); \(D_a\) =over21 - \(a\) = age centred at 21 (
age)
The dummy captures the break; the age term absorbs the smooth slope.
The vertical gap between the two fitted lines at 21 is the effect
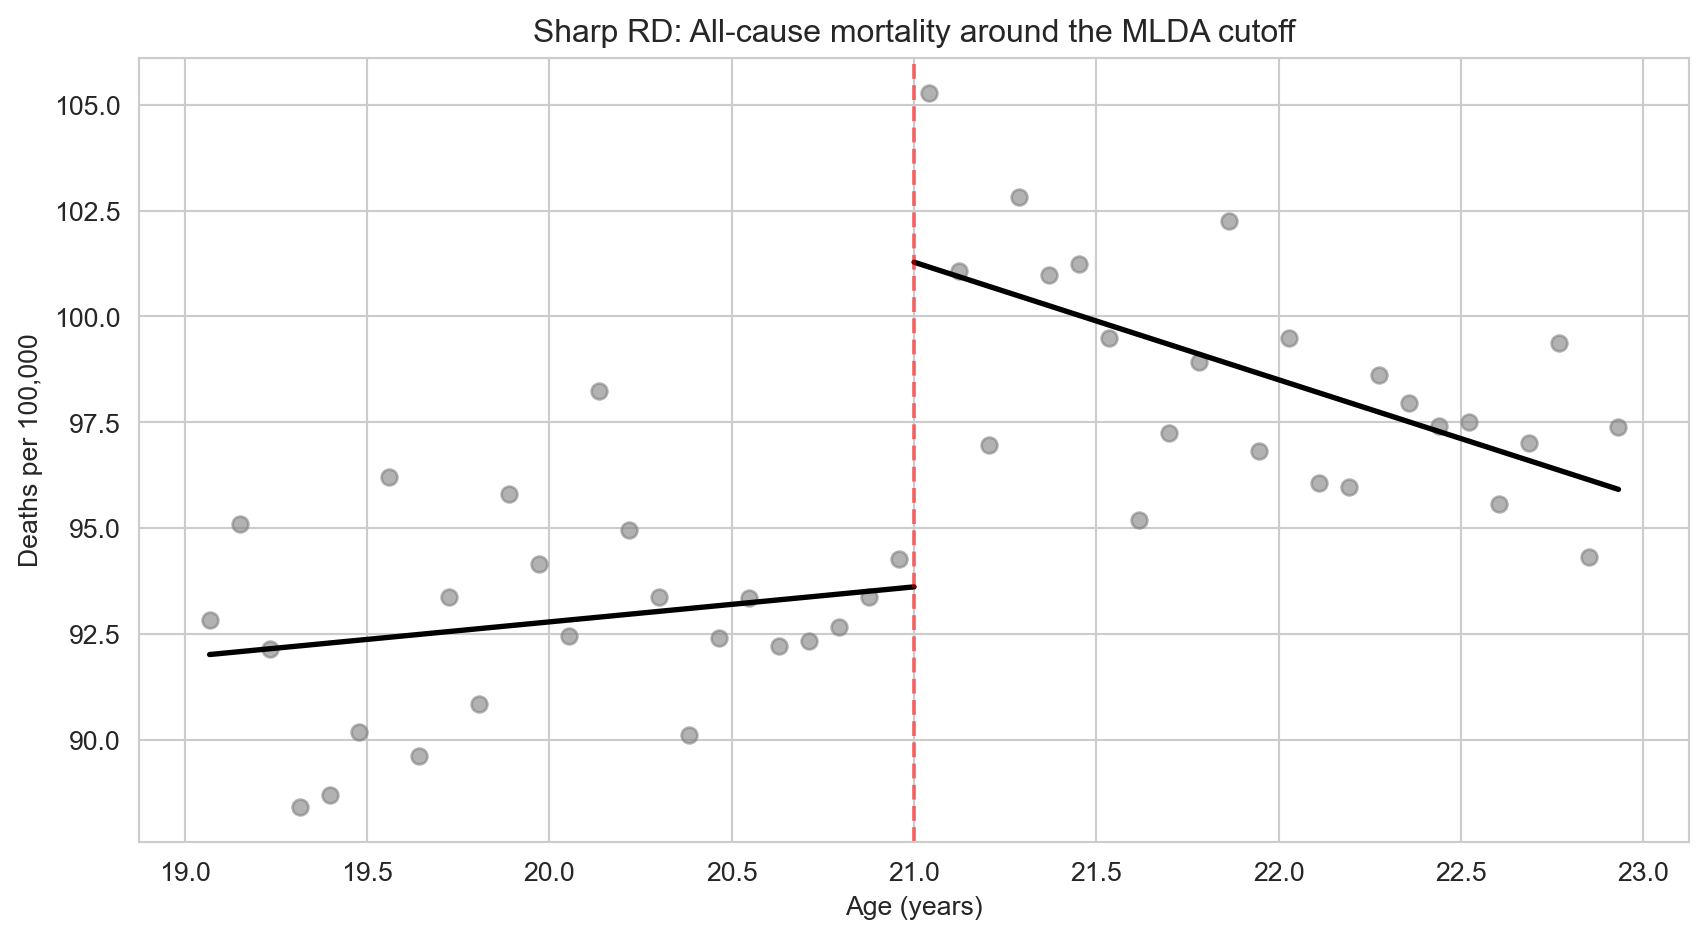
All-cause death rate with a separate straight line fitted on each side of age 21.
The data: 48 monthly age cells around the 21st birthday
| Column | Meaning |
|---|---|
agecell |
Age in years, one cell per month (19 to 23) |
age |
Age centred at 21 (0 = the cutoff) |
over21 |
Treatment dummy: 1 if 21 or older |
all, mva, suicide, internal, alcohol |
Deaths per 100,000, by cause |
age2, over_age, over_age2 |
Terms for the quadratic model |
Each row is an age, not a person: 24 cells below 21 and 24 above.
One pf.feols call estimates the sharp RD
!pip install -q pyfixest                  # pyfixest is not preinstalled in Colab

import pandas as pd                       # pandas → load tables
import pyfixest as pf                     # pyfixest → regressions with robust SEs

GITHUB_DATA_URL = "https://raw.githubusercontent.com/cmg777/intro2causal/main/data/"
mlda = pd.read_csv(GITHUB_DATA_URL + "ch4/mlda_clean.csv")   # MLDA age cells

# death rate on the over-21 switch plus a linear age trend, robust SEs
m = pf.feols("all ~ over21 + age", data=mlda, vcov="hetero")
m.summary() # over21 = 7.66 (SE 1.51); Intercept 91.84Legal access to alcohol raises the death rate at 21
+7.7
extra deaths per 100,000 at the 21st birthday — about 8% above the 91.8 just below
Motor-vehicle accidents carry most of the jump
| Cause of death | Jump at 21 (SE) |
|---|---|
| All causes | 7.66 (1.51) |
| Motor-vehicle accidents | 4.53 (0.72) |
| Suicide | 1.79 (0.50) |
| Alcohol-related (direct) | 0.44 (0.21) |
| Internal causes (disease) | 0.39 (0.54) |
More than half the extra deaths happen on the road — drunk driving is the main channel.
Diseases ignore the birthday: internal causes do not jump
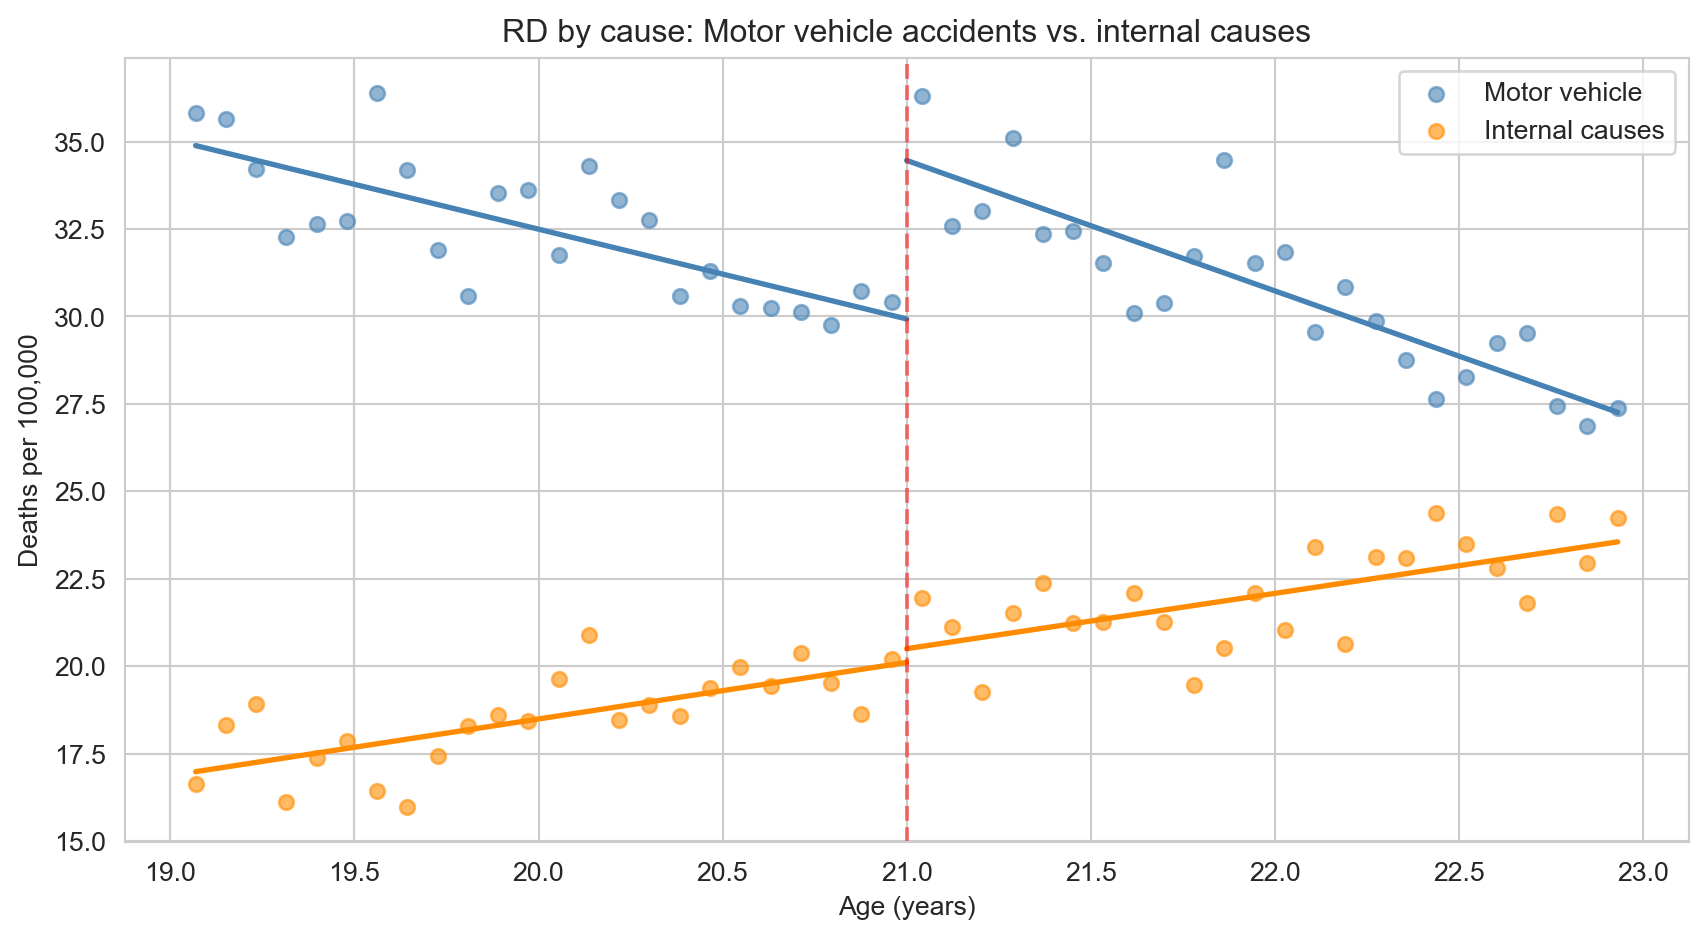
Motor-vehicle deaths (blue) and internal-cause deaths (orange), each with separate lines on either side of 21.
A placebo outcome that stays flat makes the motor-vehicle jump believable.
Swapping the outcome turns the same regression into a placebo test
!pip install -q pyfixest                  # pyfixest is not preinstalled in Colab
import pandas as pd                       # pandas → load tables
import pyfixest as pf                     # pyfixest → regressions with robust SEs

GITHUB_DATA_URL = "https://raw.githubusercontent.com/cmg777/intro2causal/main/data/"
mlda = pd.read_csv(GITHUB_DATA_URL + "ch4/mlda_clean.csv")   # MLDA age cells

for y in ["mva", "internal"]:             # a real channel, then a placebo
    m = pf.feols(f"{y} ~ over21 + age", data=mlda, vcov="hetero")   # same RD
    print(y, round(m.coef()["over21"], 2), round(m.se()["over21"], 2))
# mva 4.53 0.72 · internal 0.39 0.54A quadratic lets each side of the cutoff bend in its own way
\[M_a = \alpha + \rho D_a + \gamma_1 a + \gamma_2 a^2 + \delta_1 a D_a + \delta_2 a^2 D_a + e_a\]
Code names: \(a^2\) = age2, \(a D_a\) = over_age, \(a^2 D_a\) = over_age2.
If the jump survives a curved trend, it is not an artefact of forcing a straight line.
Narrowing the window trades precision for comparability
| Window around 21 | Age cells | Jump (SE) |
|---|---|---|
| Full sample (19 to 23) | 48 | 7.66 (1.51) |
| ± 1.5 years | 36 | 8.70 (1.63) |
| ± 1.0 year | 24 | 9.75 (2.06) |
| ± 0.5 years | 12 | 8.88 (3.03) |
Closer cells are more alike, but fewer cells mean noisier estimates — the jump stays between 7.7 and 9.8.
Robustness checks reuse the same call with a new formula or sample
!pip install -q pyfixest                  # pyfixest is not preinstalled in Colab
import pandas as pd                       # pandas → load tables
import pyfixest as pf                     # pyfixest → regressions with robust SEs

GITHUB_DATA_URL = "https://raw.githubusercontent.com/cmg777/intro2causal/main/data/"
mlda = pd.read_csv(GITHUB_DATA_URL + "ch4/mlda_clean.csv")   # MLDA age cells

narrow = mlda[(mlda["agecell"] >= 20) & (mlda["agecell"] <= 22)]   # ages 20–22 only

# interacted quadratic trend on the narrow window, robust SEs
m = pf.feols("all ~ over21 + age + age2 + over_age + over_age2",
             data=narrow, vcov="hetero")
m.summary() # over21 = 9.61 (SE 2.29)In every specification, deaths from all causes jump by 7 to 10
| Cause of death | Linear, wide | Quad., wide | Linear, narrow | Quad., narrow |
|---|---|---|---|---|
| All causes | 7.66 (1.51) | 9.55 (1.83) | 9.75 (2.06) | 9.61 (2.29) |
| Motor-vehicle | 4.53 (0.72) | 4.66 (1.09) | 4.76 (1.08) | 5.89 (1.33) |
| Suicide | 1.79 (0.50) | 1.81 (0.78) | 1.72 (0.73) | 1.30 (1.14) |
| Internal causes | 0.39 (0.54) | 1.07 (0.80) | 1.69 (0.74) | 1.25 (1.01) |
| Alcohol-related | 0.44 (0.21) | 0.80 (0.32) | 0.74 (0.33) | 1.03 (0.41) |
Wide window = all ages 19 to 23; narrow window = ages 20 to 22. Quad. = interacted quadratic. Robust SEs in parentheses.
Polynomial order and bandwidth move the estimate a little — never the conclusion.
When the cutoff only raises the odds of treatment, the RD is fuzzy
Crossing the line makes treatment more likely, not certain — a dimmer, not a switch.
Fuzzy RD is instrumental variables at a cutoff
\[\text{Effect} \;=\; \frac{\text{Jump in the outcome at the cutoff}}{\text{Jump in the probability of treatment at the cutoff}}\]
Reduced form ÷ first stage — the Wald ratio from Chapter 3, with the cutoff dummy as instrument.
If you understand IV, you already understand fuzzy RD.
Sharp and fuzzy RD answer slightly different questions
| Sharp RD | Fuzzy RD | |
|---|---|---|
| At the cutoff | Treatment switches fully | Probability of treatment jumps |
| Estimation | OLS with the running-variable trend | 2SLS, cutoff dummy as instrument |
| Interpretation | Effect of treatment at the cutoff | LATE for compliers at the cutoff |
Fuzziness adds one step — scaling by the first stage — and narrows who the effect describes.
Boston’s exam schools admit by test score — but admission is not enrollment
- Elite public high schools take applicants above an admissions-score cutoff
- Some admitted students decline; some below the line get in by other routes
- So the cutoff shifts the chance of attending — a fuzzy RD
Comparing applicants just above and just below the cutoff isolates the effect of the school itself.
At the cutoff, classmates get much stronger — test scores do not
| What changes at the admissions cutoff | Jump |
|---|---|
| Peer quality (classmates’ ability) | +0.8 SD |
| Admitted students’ own achievement | No jump |
Better peers did not translate into better results for students at the margin.
The exam-school advantage in raw data is mostly selection
- Exam-school students score far higher than other students
- RD shows the school adds little at the margin
- The raw gap reflects who gets in, not what the school does
Selection bias again: strong correlations between school quality and outcomes need not be causal.
RD estimates are local: they describe people near the cutoff
- The MLDA estimate applies to people turning 21
- At 18 or 25 the effect could be larger or smaller
- Going further from the line needs assumptions the data cannot check
RD buys strong internal validity at one margin, at the cost of reach.
RD was born in 1960, at a scholarship cutoff
- Donald Thistlethwaite and Donald Campbell studied National Merit recognition
- Students just above vs. just below the recognition cutoff
- Finding: recognition barely changed career plans
One of the first RD studies — of what is now a ubiquitous research design.
The Resolution
Act III
The tempting mistake: “RD just controls for the running variable”
Objection. RD is ordinary regression with age as a control.
Response. No age has both treated and untreated people, so there is nothing to compare at equal age. RD extrapolates each side’s trend to the cutoff — which is why the functional form and bandwidth must be varied and reported.
The tempting mistake: “A jump at 21 proves alcohol kills”
Objection. Death rates break at 21, and 21 is the drinking age — case closed.
Response. Only if nothing else switches at 21. The design earns belief when other influences stay smooth and placebo outcomes stay flat — as internal-cause deaths do.
Key takeaways
- Cutoff rules create natural experiments for people near the line
- The effect is the jump at the cutoff, net of the smooth trend
- Plot first, then vary the polynomial and the bandwidth
- Placebo outcomes guard the design; RD estimates are local
- Fuzzy RD = instrumental variables at a cutoff