The Question
Act I
Does staying in school longer actually make you earn more?
College graduates earn roughly twice as much as high school graduates.
How much of that gap does school cause — and how much is about who chooses to stay in school?
In the 1980 Census, each extra year of school goes with higher pay
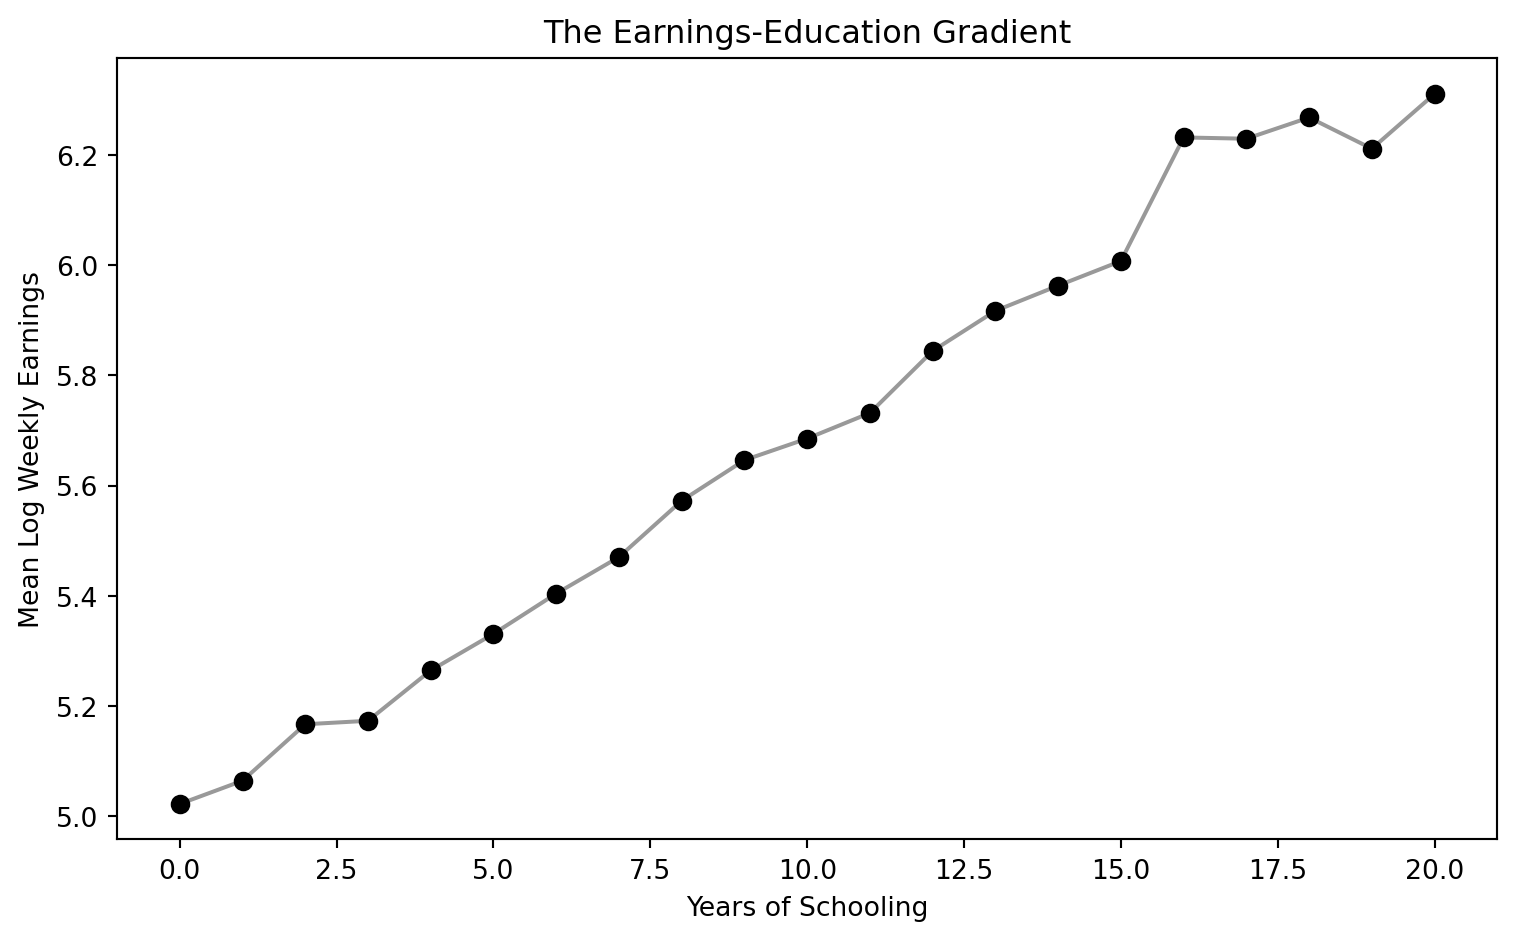
Average log weekly earnings by years of schooling — men born 1930–1939.
The gradient is steep and smooth. Is it a causal staircase, or a sorting of people by talent?
One regression puts a number on the gradient: about 7% per year
!pip install -q pyfixest                  # pyfixest is not preinstalled in Colab
import pandas as pd                       # pandas → load tables
import pyfixest as pf                     # pyfixest → regressions with robust SEs

GITHUB_DATA_URL = "https://raw.githubusercontent.com/cmg777/intro2causal/main/data/"
qob = pd.read_csv(GITHUB_DATA_URL + "ch6/qob_clean.csv")   # 1980 Census, men born 1930–39

# log weekly earnings on years of schooling, robust (hetero) SEs
m = pf.feols("lnw ~ s", data=qob, vcov="hetero")
m.summary() # s: 0.0709 (0.0004) → ~7% per yearOur route through the chapter
- The question — why a precise 7% correlation is not yet a causal return
- The investigation — ability bias, then five designs: twins, birth-quarter IV, child-labor-law IV, a diploma RD, and a policy DD
- The resolution — which estimates to trust, and why their agreement matters more than any one
One question, five tools: each rung fixes a weakness of the one below
| Rung | What it fixes | Its own weak spot |
|---|---|---|
| OLS | — (the starting point) | Ability bias |
| Twin comparisons | Shared genes and upbringing | Noisy schooling reports |
| Birth-quarter IV | Ability and noise | Applies to would-be dropouts |
| Child-labor-law IV | A second, policy-driven source of variation | Weak instruments |
| Diploma RD | Asks: skills or the piece of paper? | Only local to the pass mark |
| Reform DD | Before-vs-after policy comparison | Needs parallel trends |
This chapter is a capstone: every method in the course, aimed at a single parameter.
Three ideas carry the whole chapter
Return to schooling
\(\rho\) — the percentage gain in earnings caused by one more year of school.
Ability bias
Able people study longer and earn more, so OLS credits school for talent.
Measurement error
Misreported schooling dilutes the signal and drags estimates toward zero.
Ability pushes estimates up; noise pushes them down. The chapter is a tug-of-war between the two.
The Investigation
Act II
The simple model hides ability inside the error term
\[\ln W_i = \alpha + \rho\, S_i + e_i\]
\(\ln W_i\) is log weekly earnings (lnw), \(S_i\) years of schooling (s); ability, motivation and family background all sit in \(e_i\).
\[\hat\rho_{OLS} = \rho + \text{ability bias}\]
If \(S_i\) is correlated with what sits in \(e_i\), OLS measures the return plus a bias.
Ability raises both schooling and earnings, so OLS likely runs high
\[\text{OVB} = \gamma \times \pi_1 > 0\]
- \(\gamma\): ability’s effect on earnings
- \(\pi_1\): how ability tracks schooling
Twist: if star talents drop out early to chase big opportunities, the bias could even turn negative.
Adding demographic controls barely moves the estimate
| Twinsburg twins, OLS with controls | Coefficient (SE) |
|---|---|
| Years of education | 0.110 (0.010) |
| Age | 0.104 (0.012) |
| Age squared (÷100) | −0.106 (0.015) |
| Female | −0.318 (0.040) |
| White | −0.100 (0.068) |
Age, gender and race are not ability — so ~11% per year still carries any ability bias.
When we can see ability, omitting it inflates the return by ~40%
| Synthetic data (true return 0.09) | Schooling coefficient (SE) |
|---|---|
| Short regression: omit ability | 0.1229 (0.0024) |
| Long regression: include ability | 0.0853 (0.0036) |
| True causal return | 0.0900 |
In real data ability is invisible, so the long regression is a luxury we never get.
Controlling for occupation blocks a real channel of the return
Adding occupation shrinks the coefficient from 0.123 to 0.100 — not less bias, but a lost pathway.
Never control for an outcome of the treatment: it is a bad control.
The ideal experiment — randomizing schooling — is off the table
- Forcing some children to drop out is unethical
- Assigning years of school by lottery for decades is impractical
But a lottery for a scholarship that nudges schooling is imaginable — and shows what we are aiming for.
We need designs that mimic random assignment without forcing anyone’s education.
A scholarship lottery recovers the true return with a Wald ratio
| Synthetic scholarship lottery (true return 0.08) | Estimate |
|---|---|
| Scholarship → schooling (first stage) | 1.958 years |
| Scholarship → earnings (reduced form) | 0.1605 log points |
| Per-year return (reduced form ÷ first stage) | 0.0820 |
\[\hat\rho = \frac{\text{reduced form}}{\text{first stage}}\]
A random push to schooling, scaled by how much schooling moved, isolates the return per year.
Comparing identical twins cancels shared genes and upbringing
\[\Delta Y_f = \rho\, \Delta S_f + \Delta e_f\]
\(\Delta Y_f\) is the wage gap within twin pair \(f\) (dlwage); \(\Delta S_f\) the schooling gap (deduc). Anything both twins share drops out of the difference.
If ability is shared within a pair, differencing removes ability bias by construction.
Within twin pairs, the return falls to about 6%
| Method (Twinsburg twins) | Return to schooling (SE) |
|---|---|
| OLS with controls (levels) | 0.110 (0.010) |
| Twin fixed effects (differences) | 0.062 (0.020) |
Removing shared ability nearly halves the estimate — but is lower really closer to the truth?
Twin fixed effects is one regression on within-pair differences
!pip install -q pyfixest                  # pyfixest is not preinstalled in Colab
import pandas as pd                       # pandas → load tables
import pyfixest as pf                     # pyfixest → regressions with robust SEs

GITHUB_DATA_URL = "https://raw.githubusercontent.com/cmg777/intro2causal/main/data/"
twins = pd.read_csv(GITHUB_DATA_URL + "ch6/twins_clean.csv")   # Twinsburg twins

first = twins[twins["first"] == 1]        # keep one row per pair (no double counting)
# wage gap on schooling gap; "- 1" drops the intercept (equal school → no gap)
fe = pf.feols("dlwage ~ deduc - 1", data=first, vcov="hetero")
fe.summary() # deduc: 0.0617 (0.0198) → ~6%Differencing shrinks the signal but not the noise
\[\hat\rho_{FE} \approx \rho \times \underbrace{\frac{\text{Var}(\Delta S^*_f)}{\text{Var}(\Delta S^*_f) + \text{Var}(\Delta m_f)}}_{\text{reliability ratio}}\]
\(\Delta S^*_f\): true schooling gap within a pair · \(\Delta m_f\): gap in reporting errors.
Twins have similar schooling, so errors dominate — a reliability ratio of 0.5 would halve the estimate.
Using the co-twin’s report as an instrument restores ~11%
| Method (Twinsburg twins) | Return to schooling (SE) |
|---|---|
| OLS (levels) | 0.110 (0.010) |
| Twin FE (differences) | 0.062 (0.020) |
| IV with co-twin’s report (levels) | 0.116 (0.011) |
| IV with co-twin’s report (differences) | 0.108 (0.034) |
An independent second measurement filters out the noise — and the return climbs back to ~11%.
Twins solve one problem but leave two caveats
Who is in the sample?
Twins who attend a festival in Ohio are self-selected — they may not represent all workers.
Are the errors independent?
If twins agree on a wrong answer, their reports share errors and the IV fix weakens.
Twin designs are clever but fragile; we need variation in schooling that is precisely measured.
Birth timing plus dropout laws keeps Q4 babies in school longer
1980 Census: 329,509 men born 1930–1939 (Angrist and Krueger, 1991). Instrument: born in the fourth quarter (q4).
Birth quarter is unrelated to ability, but it shifts how much school a would-be dropout completes.
Q4 births get slightly more school — and slightly higher pay
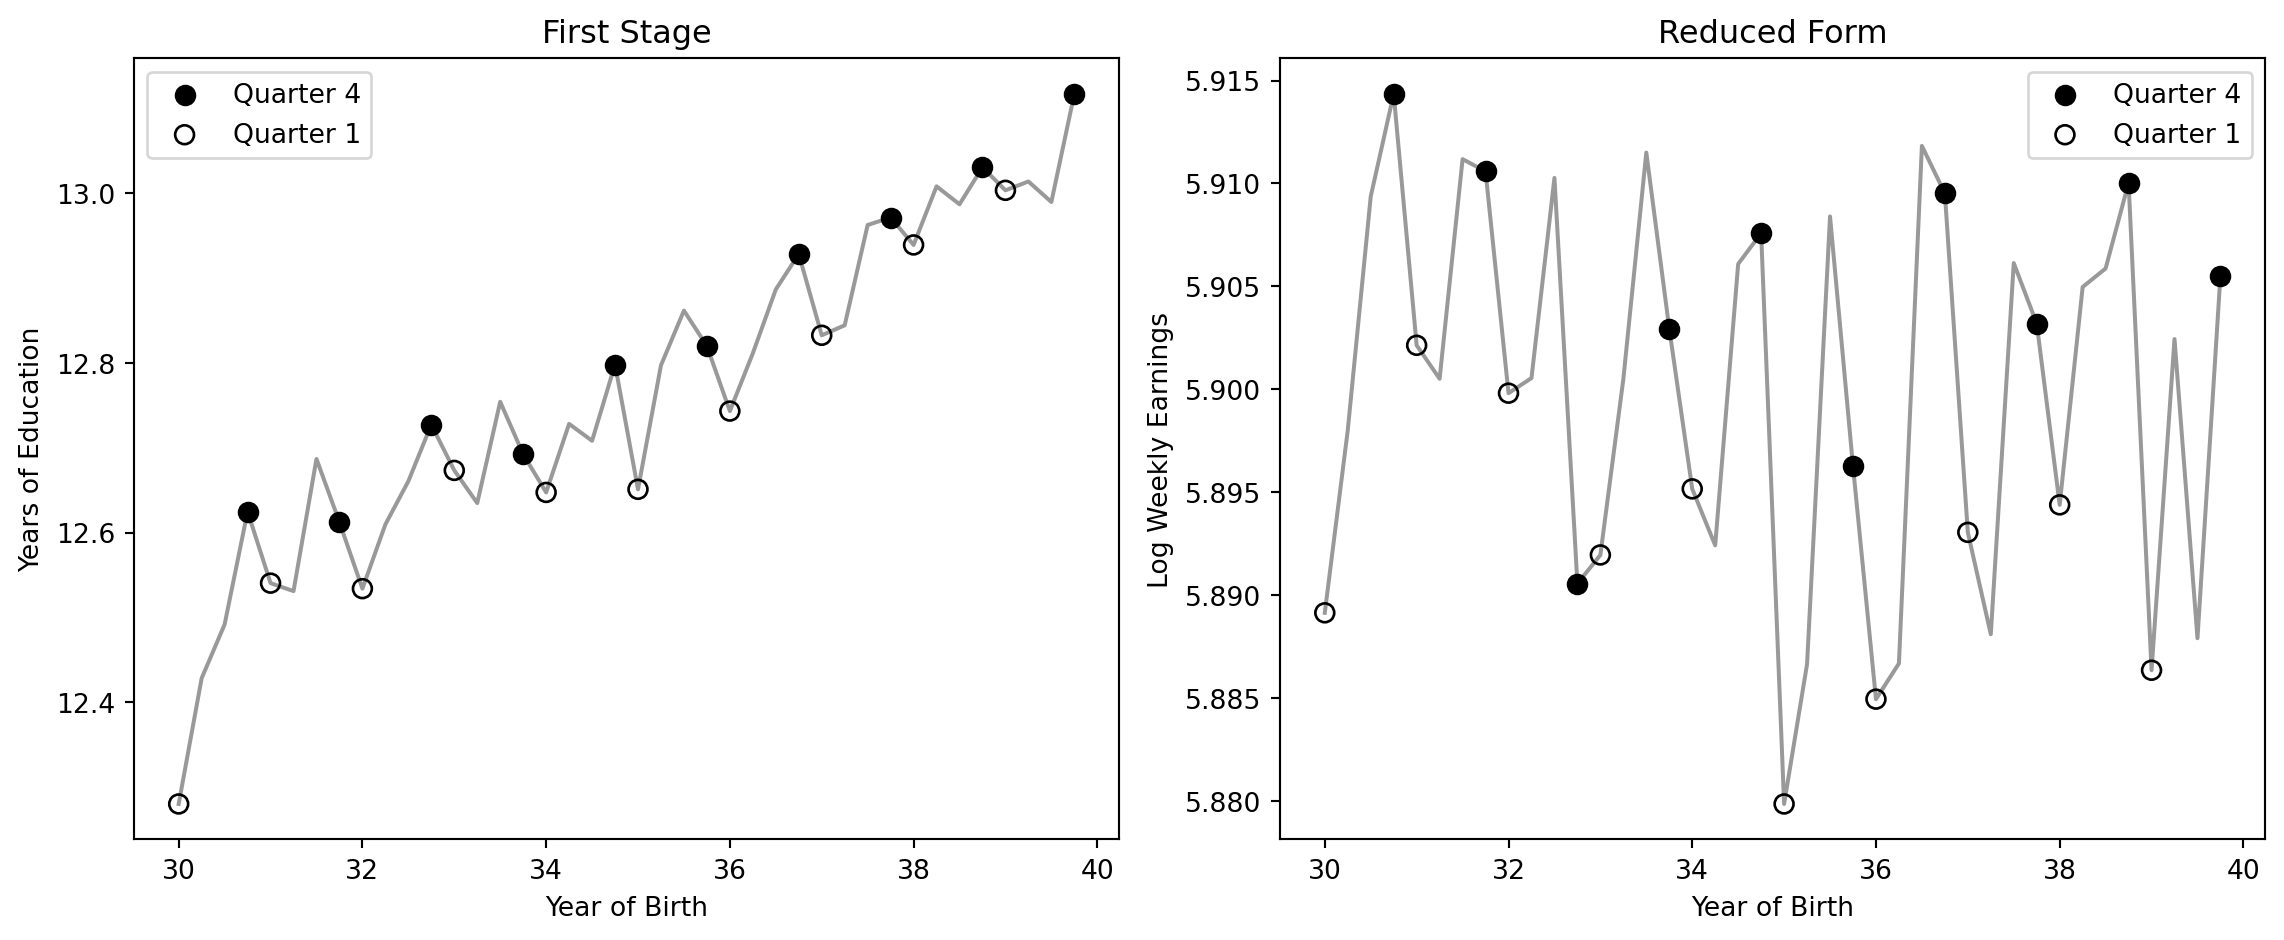
Filled dots = Q4 births, hollow = Q1 births. Left: years of education; right: log weekly earnings.
The same saw-tooth appears in both panels: the first stage and the reduced form line up.
Dividing the reduced form by the first stage gives about 7%
| Step | Estimate (SE) |
|---|---|
| Reduced form: Q4 → log earnings | 0.0068 (0.0027) |
| First stage: Q4 → years of school | 0.0921 (0.0132) |
| Wald ratio (reduced form ÷ first stage) | 0.0740 |
| 2SLS | 0.0740 (0.0280) |
A tenth of a year of extra school, worth 0.7% more pay, implies a return of about 7% per year.
Three regressions and a ratio reproduce the birth-quarter IV
!pip install -q pyfixest                  # pyfixest is not preinstalled in Colab
import pandas as pd                       # pandas → load tables
import pyfixest as pf                     # pyfixest → OLS and IV/2SLS

GITHUB_DATA_URL = "https://raw.githubusercontent.com/cmg777/intro2causal/main/data/"
qob = pd.read_csv(GITHUB_DATA_URL + "ch6/qob_clean.csv")   # 1980 Census, men born 1930–39

fs = pf.feols("s ~ q4", data=qob, vcov="hetero")     # first stage: Q4 → schooling (0.092)
rf = pf.feols("lnw ~ q4", data=qob, vcov="hetero")   # reduced form: Q4 → earnings (0.0068)
print(rf.coef()["q4"] / fs.coef()["q4"])             # Wald ratio = 0.074
iv = pf.feols("lnw ~ 1 | s ~ q4", data=qob, vcov="hetero")   # 2SLS: s instrumented by q4
iv.summary() # s: 0.0740 (0.0280) — same as the Wald ratioThe IV return applies to students at the dropout margin
Compliers
Would-be dropouts whose schooling was changed by their birth quarter — the LATE is their return.
Not compliers
College-bound students and very early leavers: their schooling does not depend on birth quarter.
7% is the return for students on the edge of leaving school — not necessarily for future graduates.
State laws on school-entry age provide a second set of instruments
\[S_{scy} = \phi_1 CL7_{sc} + \phi_2 CL8_{sc} + \phi_3 CL9_{sc} + \beta_s + \gamma_c + \delta_y + v_{scy}\]
\(CL7, CL8, CL9\): state required school entry by age 7, 8 or 9 (cl7, cl8, cl9) · \(\beta_s\) state of birth · \(\gamma_c\) birth cohort · \(\delta_y\) census year — all absorbed as fixed effects.
Laws differ across states and cohorts, so a child’s required schooling depends on where and when they were born.
The child-labor-law IV doubles the return: 13% vs 7%
| Method (state, cohort, census-year FE) | Return to schooling (SE) |
|---|---|
| OLS | 0.0698 (0.0066) |
| IV / 2SLS (entry-age laws as instruments) | 0.1288 (0.0371) |
The instrumented return is larger than OLS — the opposite of what pure ability bias predicts.
A first-stage F of 6 signals weak instruments
| First stage: instrument → years of school | Coefficient (SE) |
|---|---|
| Entry required by age 7 | 0.1690 (0.0674) |
| Entry required by age 8 | 0.1872 (0.0621) |
| Entry required by age 9 | 0.3973 (0.0984) |
| Joint F-statistic | 6.06 |
Below the rule-of-thumb of 10, IV estimates are imprecise and can be biased — read 13% with caution.
Fixed effects, weights and clusters fit in one IV formula
!pip install -q pyfixest                  # pyfixest is not preinstalled in Colab
import pandas as pd                       # pandas → load tables
import pyfixest as pf                     # pyfixest → IV with absorbed fixed effects

GITHUB_DATA_URL = "https://raw.githubusercontent.com/cmg777/intro2causal/main/data/"
cl = pd.read_csv(GITHUB_DATA_URL + "ch6/childlabor_clean.csv")  # state × cohort × census cells

# controls | fixed effects | endogenous ~ instruments; cell-size weights; cluster by state
iv = pf.feols("lnwkwage ~ 1 | sob + yob + year | indEduc ~ cl7 + cl8 + cl9",
              data=cl, weights="weight", vcov={"CRV1": "sob"})
iv.summary() # indEduc: 0.1288 (0.0371) vs OLS 0.0698Skills or the piece of paper? Two theories predict different jumps
Human capital
School builds skills. Students just above and below a pass mark have the same skills → no earnings jump.
Signaling
The diploma signals ability to employers. Holding it should pay → an earnings jump at the pass mark.
Texas last-chance exit exam (Clark and Martorell, 2014): 46 score bins around the passing line.
An RD at the exam cutoff tests the value of the credential itself — the sheepskin effect.
Passing raises diploma receipt sharply; earnings barely notice
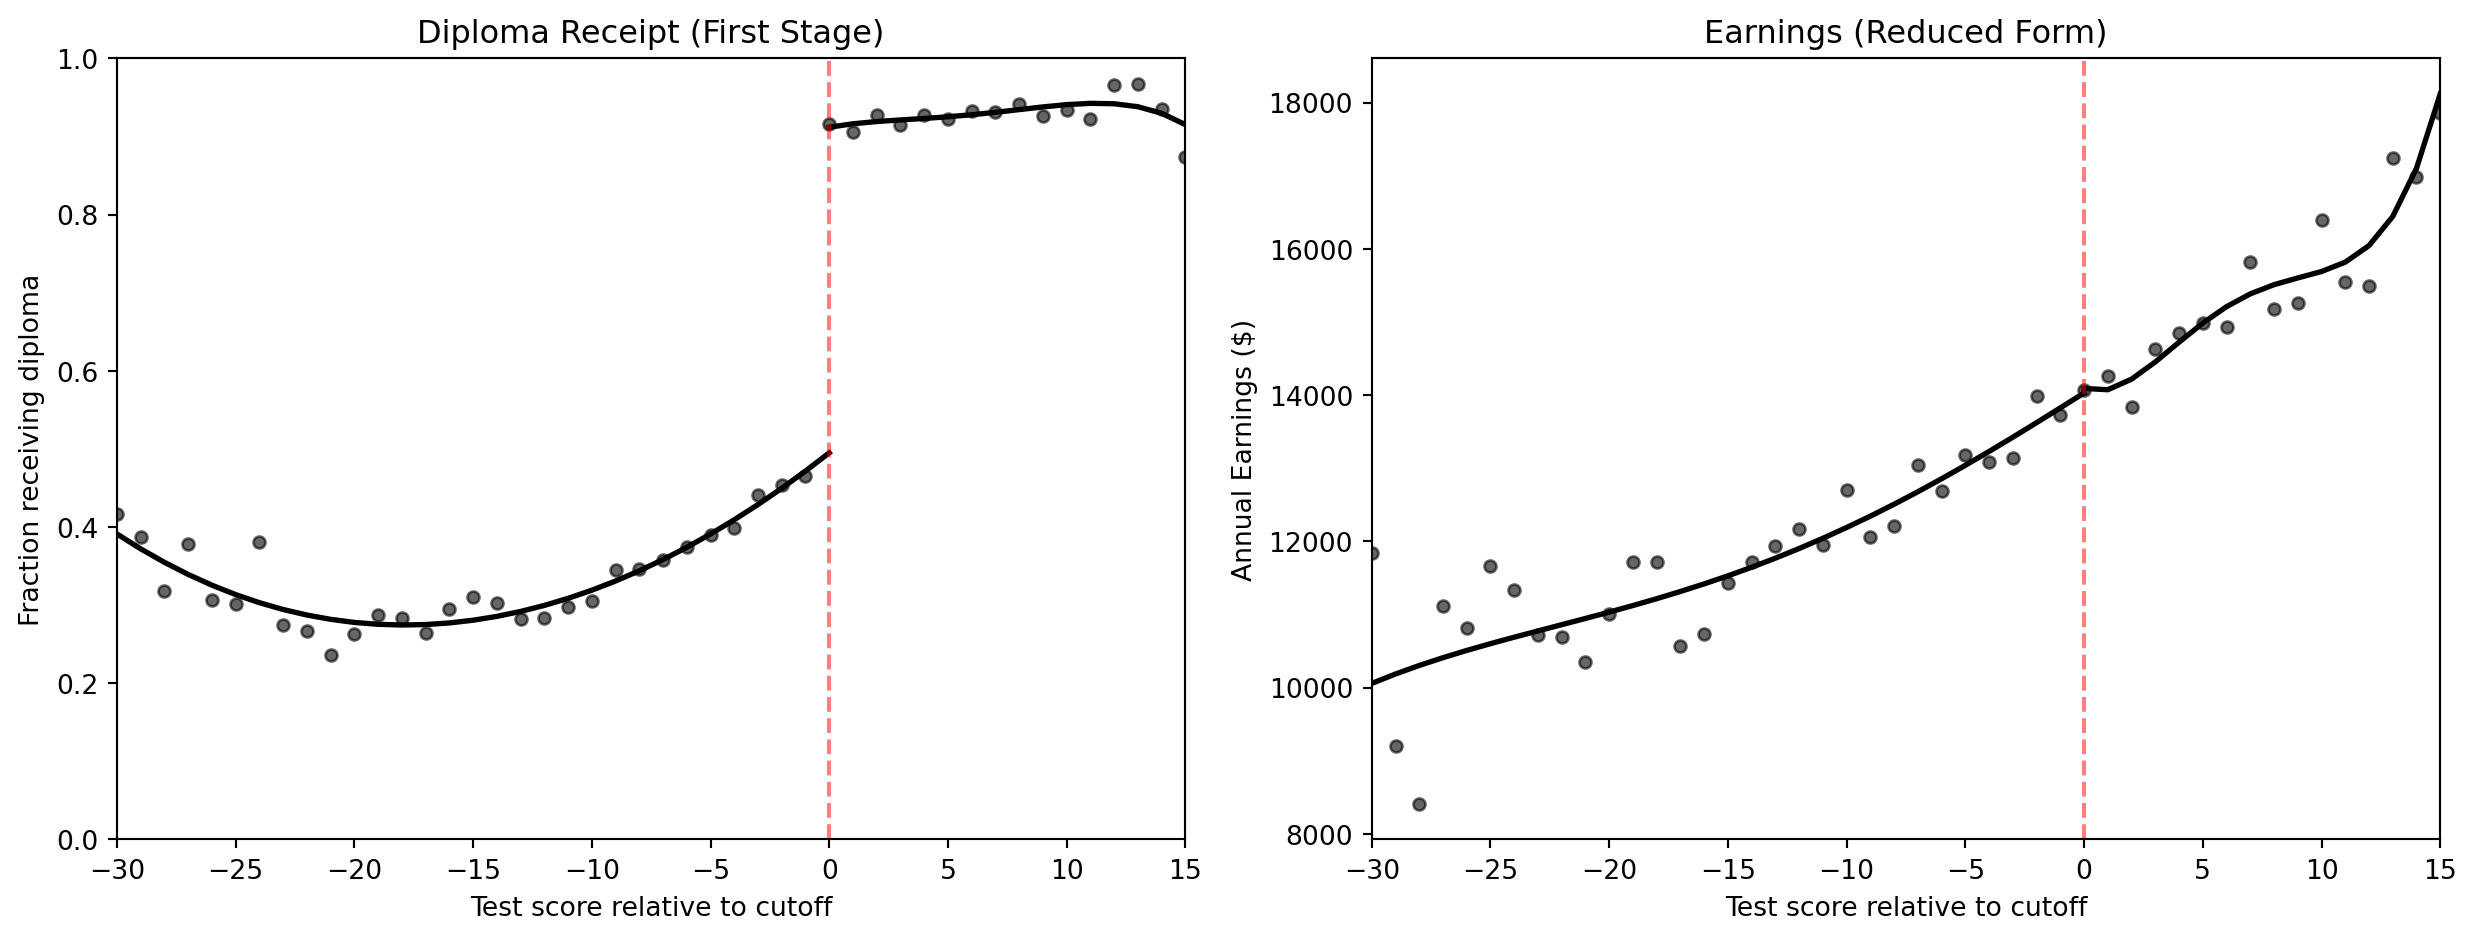
Left: share receiving a diploma. Right: average annual earnings. Dashed line = passing score.
A big jump on the left, almost none on the right: the credential changes hands, the paycheck doesn’t.
The diploma jumps ~42 points, but earnings move only ~$60
| Jump at the passing score (quartic on each side) | Estimate (SE) |
|---|---|
| Diploma receipt (share) | 0.417 (0.011) |
| Annual earnings ($) | 62 (284) |
| Earnings level just below the cutoff ($) | ~14,000 |
The credential alone adds almost nothing — the premium comes from what students learn.
A schooling reform in half the states shows parallel pre-trends
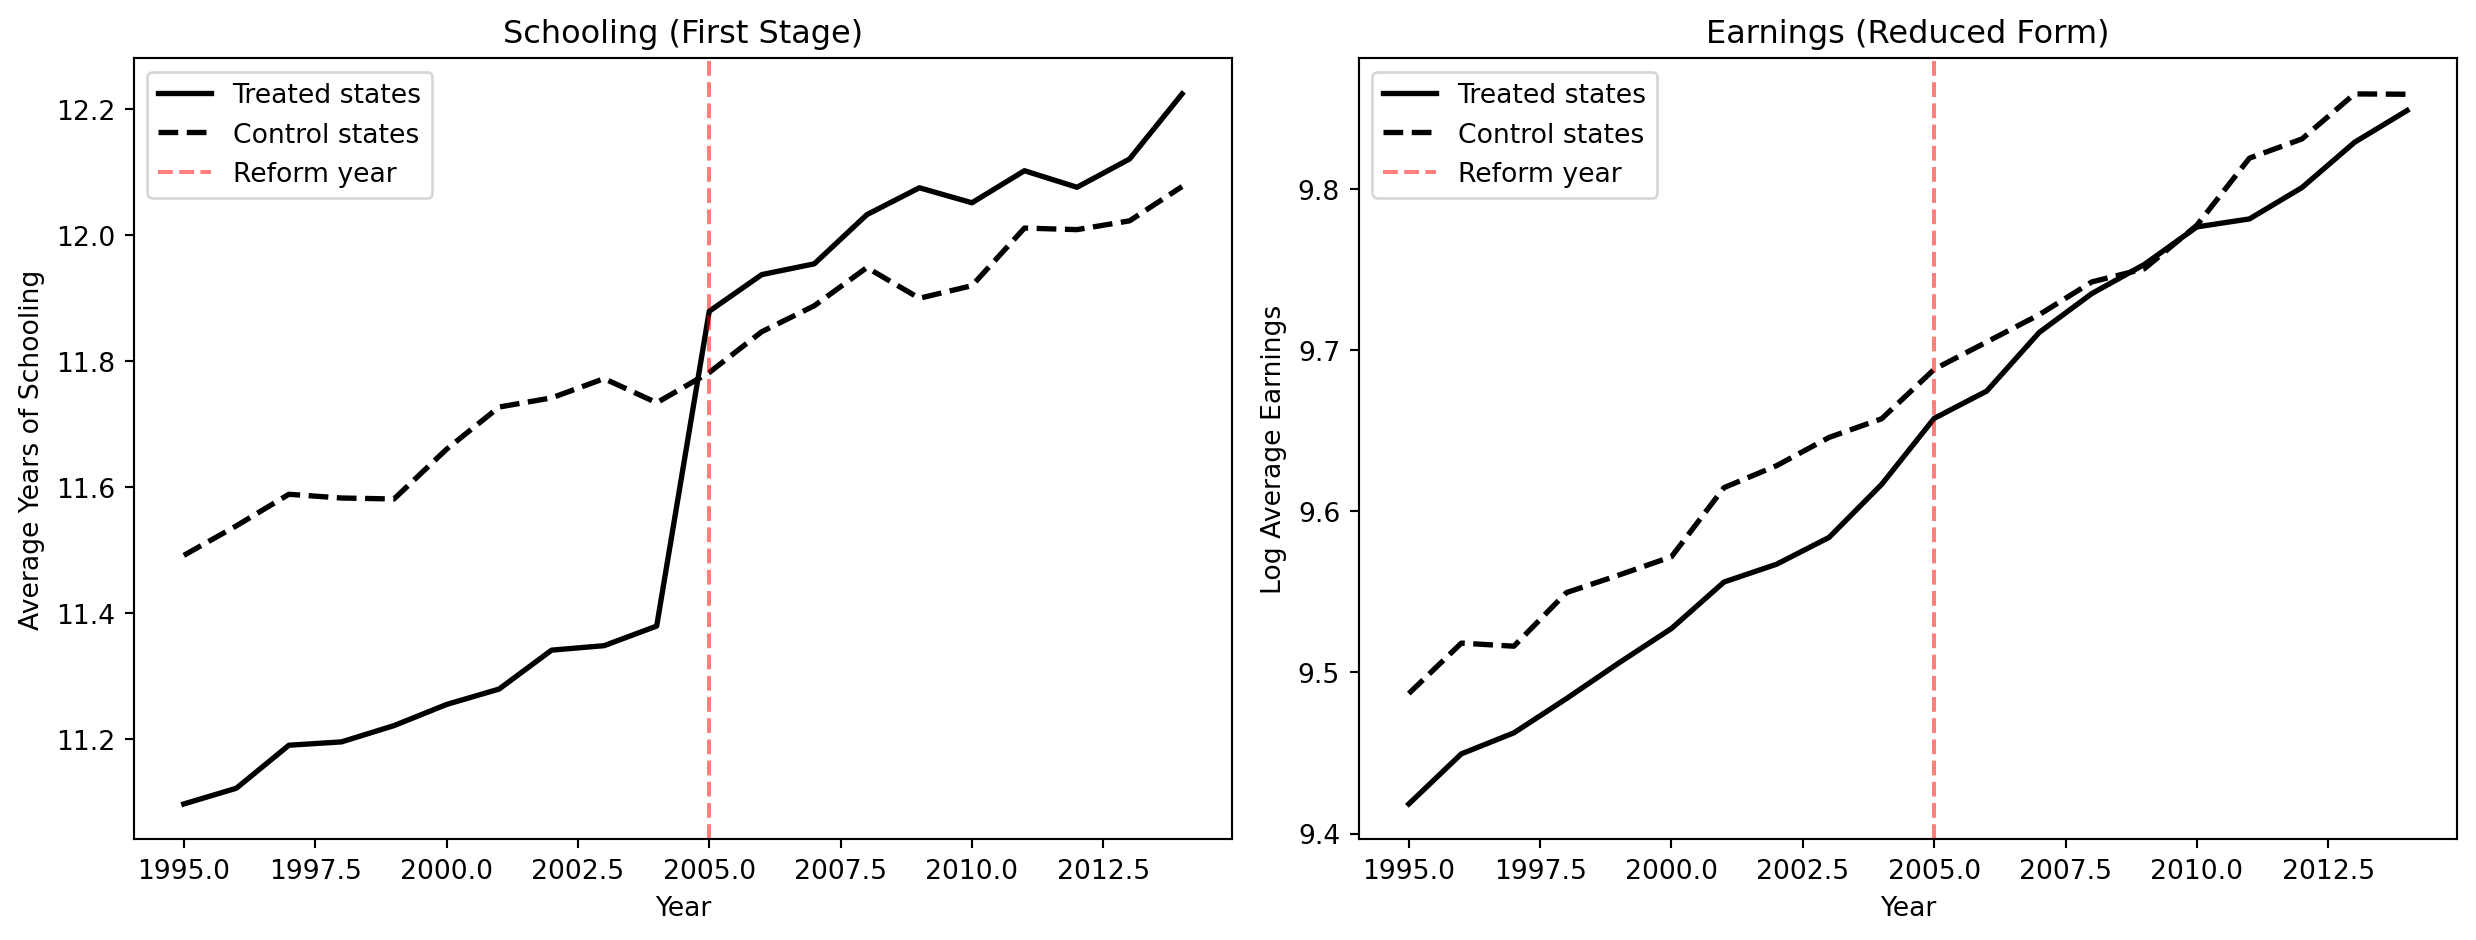
Synthetic data: 10 reform states (solid) vs 10 comparison states (dashed); reform in 2005.
Before 2005 the two groups move in parallel; after, reform states jump in schooling and their earnings catch up.
DD on earnings ÷ DD on schooling gives a return of about 8%
| Two-way fixed-effects DD (state + year FE) | Estimate (SE) |
|---|---|
| Reform → years of school (“first stage”) | 0.5039 (0.0165) |
| Reform → log earnings (“reduced form”) | 0.0393 (0.0055) |
| Implied return per year (ratio) | 0.0779 |
It is the same policy variation the child-labor-law IV uses — now read as before-vs-after.
Two-way fixed effects and a ratio give the DD return
!pip install -q pyfixest                  # pyfixest is not preinstalled in Colab
import pandas as pd                       # pandas → load tables
import pyfixest as pf                     # pyfixest → two-way fixed-effects DD

GITHUB_DATA_URL = "https://raw.githubusercontent.com/cmg777/intro2causal/main/data/"
did = pd.read_csv(GITHUB_DATA_URL + "ch6/synthetic_did.csv")   # 20 states × 20 years

did["treat_post"] = did["treated"] * did["post"]   # 1 = reform state after 2005
# DD with state and year fixed effects; cluster SEs by state
s = pf.feols("avg_schooling ~ treat_post | state + year", data=did, vcov={"CRV1": "state"})
e = pf.feols("avg_earnings ~ treat_post | state + year", data=did, vcov={"CRV1": "state"})
print(e.coef()["treat_post"] / s.coef()["treat_post"]) # implied return: 0.078Side by side, the designs bracket the return to schooling
| Design | Data | Return per year | Main weak spot |
|---|---|---|---|
| Simple OLS | 1980 Census | 0.071 | Ability bias (up) |
| OLS + controls | Twins | 0.110 | Ability bias (up) |
| Twin fixed effects | Twins | 0.062 | Noisy reports (down) |
| Twin IV (levels / diffs) | Twins | 0.116 / 0.108 | Shared misreports |
| Birth-quarter IV | 1980 Census | 0.074 | LATE for dropouts only |
| Child-labor-law IV | Census cells | 0.129 | Weak IV (\(F = 6\)) |
| Reform DD | Synthetic | 0.078 | Parallel trends |
| Diploma RD | Texas | ≈ 0 (credential) | Diploma only, not years |
Each design fails differently, yet all point to a sizable return — roughly 7–10% per year.
The Resolution
Act III
The tempting mistake: “Twin FE is lowest, so it must be closest to the truth”
Objection. Differencing removes ability, so the smallest estimate (6%) is the cleanest.
Response. Differencing also magnifies reporting errors. Once the co-twin’s report corrects the noise, the within-pair return climbs back to about 11%. Lower is not the same as less biased.
The tempting mistake: “No diploma jump means school does not pay”
Objection. At the Texas cutoff the diploma barely changes earnings, so education is worthless.
Response. The RD prices the paper, not the years. Earnings still rise steadily with skills, and the IV designs find 7%+ per year — school pays through learning, not the credential.
Key takeaways
- Raw OLS (~7%) mixes the causal return with ability bias
- Twins remove shared ability but magnify reporting errors (6%)
- Instruments correct the noise and point to roughly 7–10%
- The diploma itself is worth little; learning drives the premium
- Trust convergence across designs with different weak spots