The ExPdPy Streamlit app
No installation required — try the full app live in your browser:
ExPdPy also ships as a Streamlit app — the same no-code interface as the Shiny version, reorganised into a multipage layout with native, sortable tables, and ready to deploy on Streamlit Community Cloud. It is provided by the streamlit extra:
pip install "expdpy[streamlit] @ git+https://github.com/cmg777/expdpy.git"
# or, with uv:
uv pip install "expdpy[streamlit] @ git+https://github.com/cmg777/expdpy.git"
Once published to PyPI, pip install "expdpy[streamlit]" will work directly.
Using the app
Launching on a DataFrame
from expdpy.streamlit_app import ExPdPy
from expdpy.data import load_kuznets, load_kuznets_data_def, get_config

ExPdPy(
    load_kuznets(),
    df_def=load_kuznets_data_def(),     # identifies the panel dimensions (country x year)
    config_list=get_config("kuznets"),  # opens on the N-shaped Kuznets curve
)
This serializes your data to a temporary bundle and starts streamlit run in a subprocess, opening a browser. The sidebar holds the global pipeline — dataset/sample picker, file upload, subset filter, outlier treatment, user-defined variables, and config save/load + notebook export — and the analysis components are grouped into pages you switch between in the navigation menu.
The pages
| Page | Components |
|---|---|
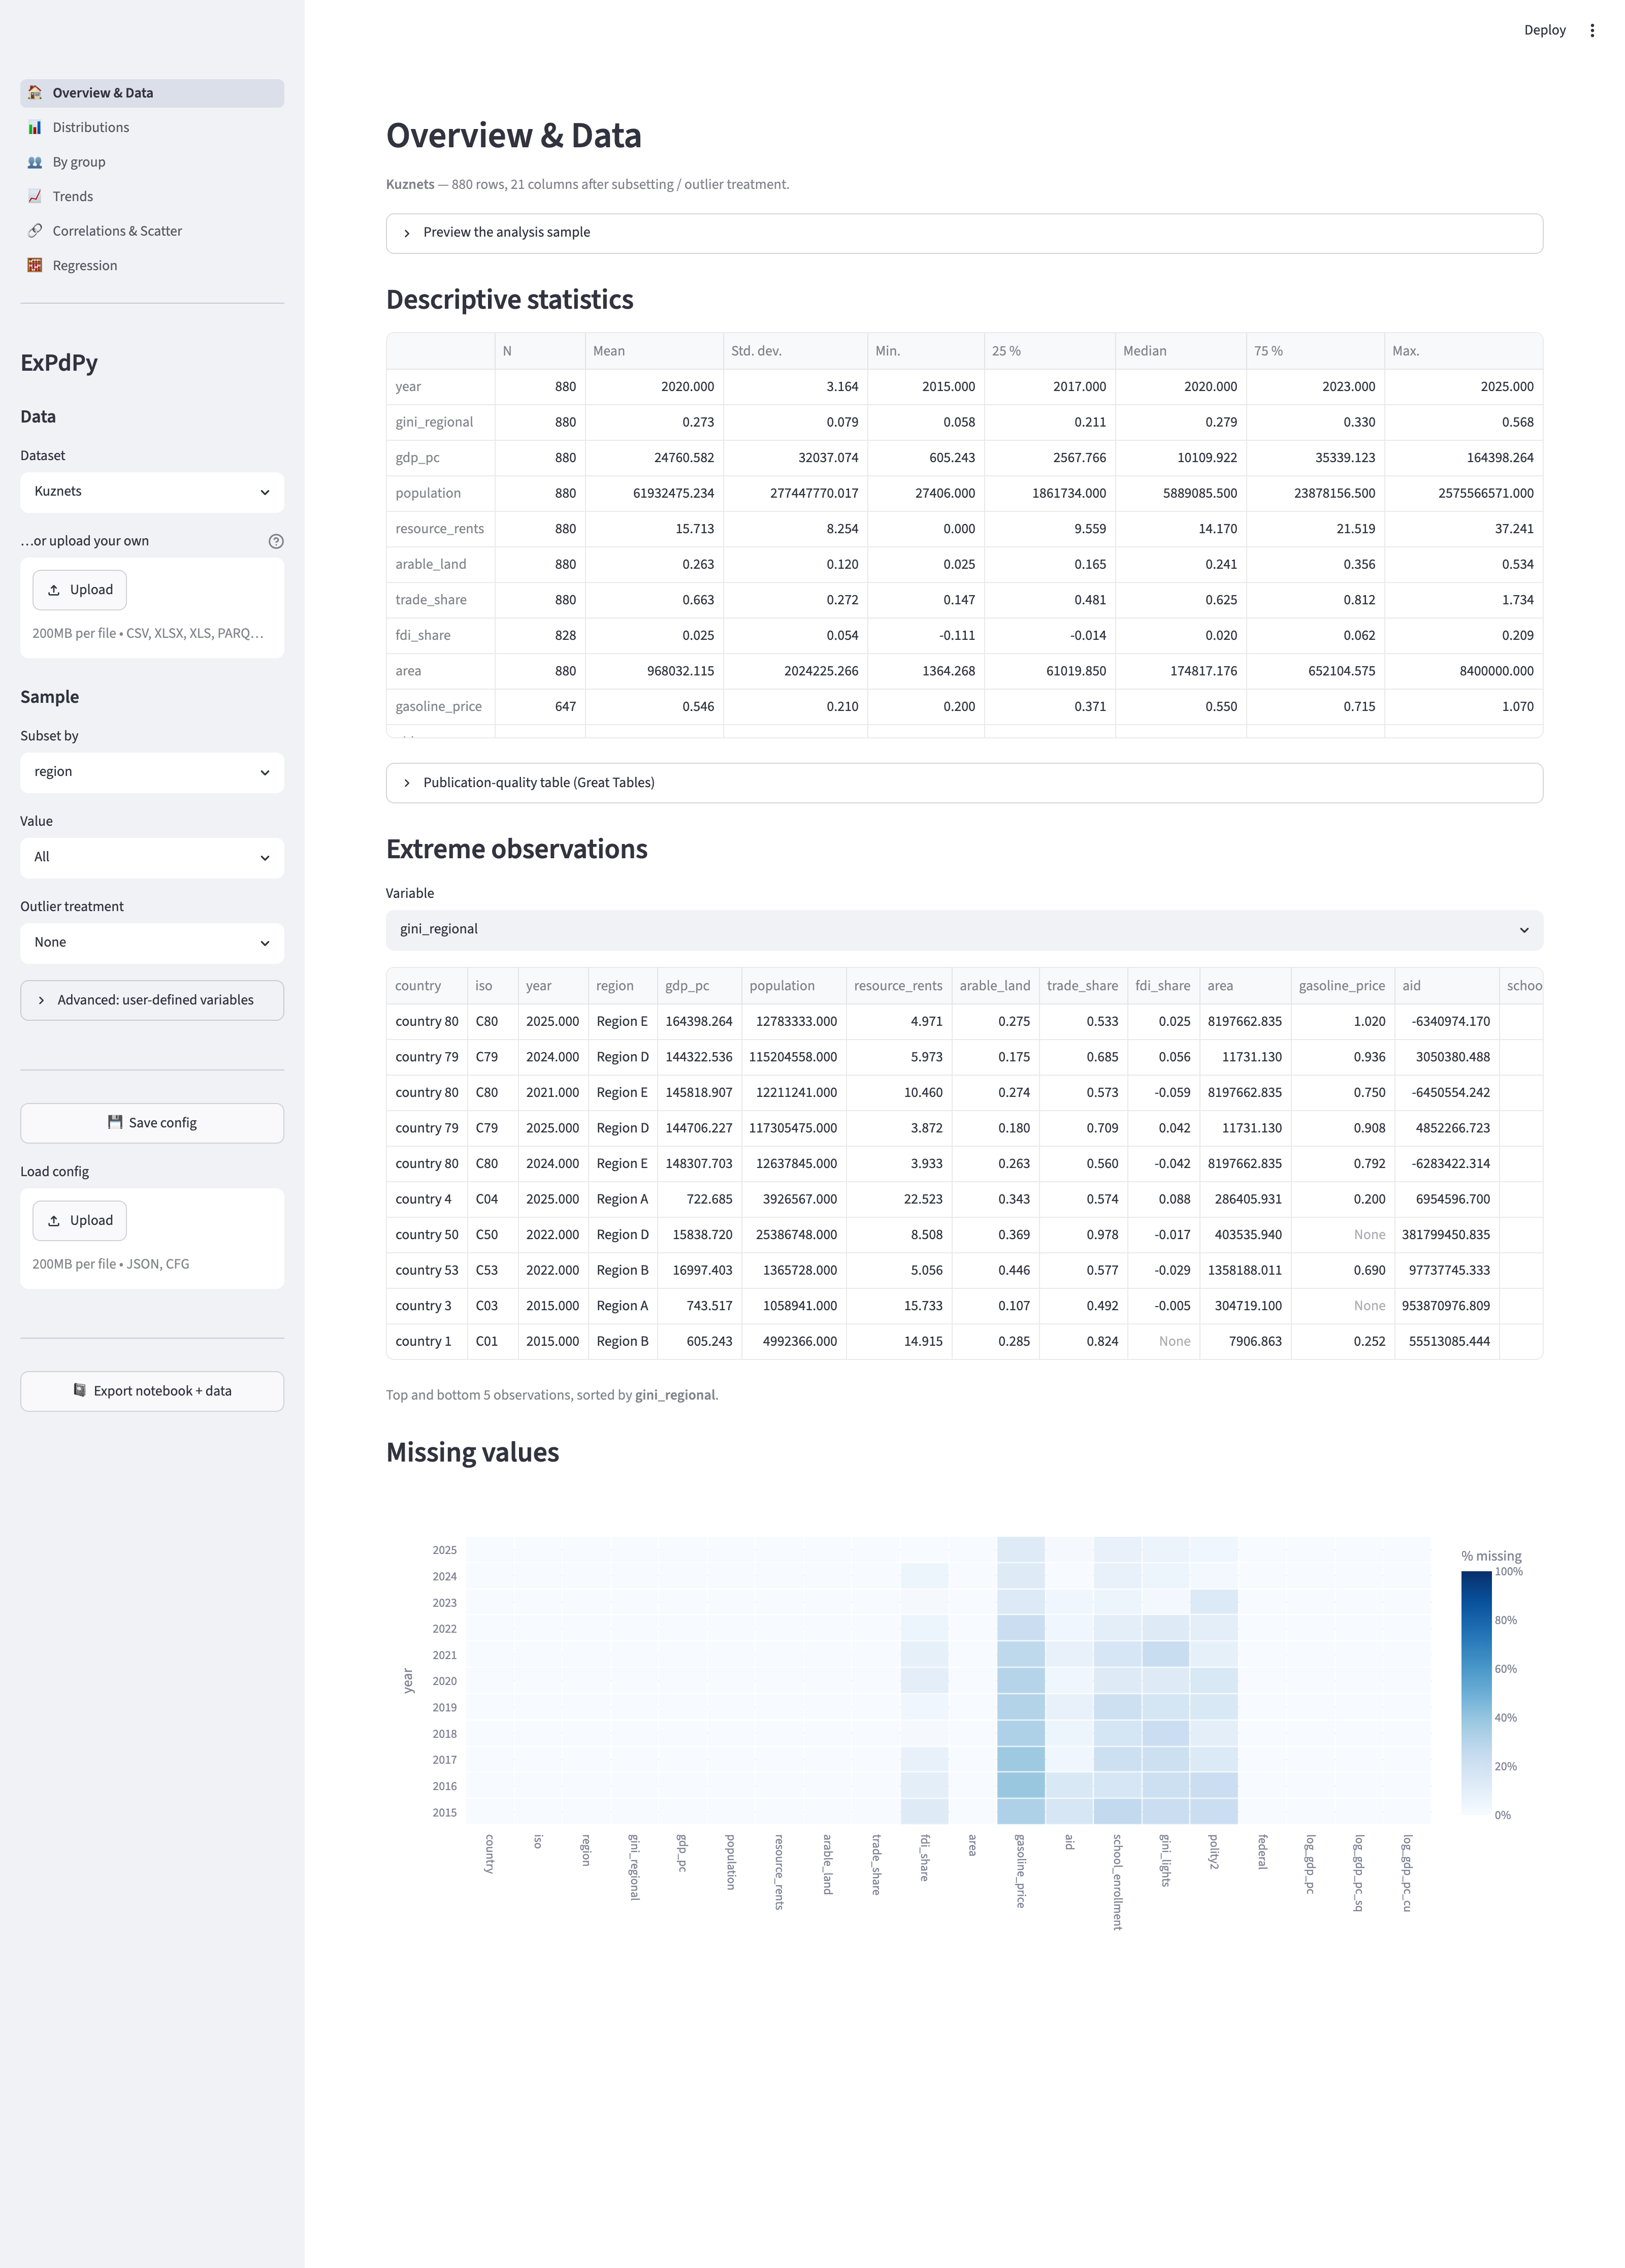
| Overview & Data | sample preview, descriptive statistics, extreme observations, missing-value heatmap |
| Distributions | histogram, category bar chart |
| By group | group means (bar), distribution (violin), group means over time |
| Trends | variable trend (1–3 series), quantile trend |
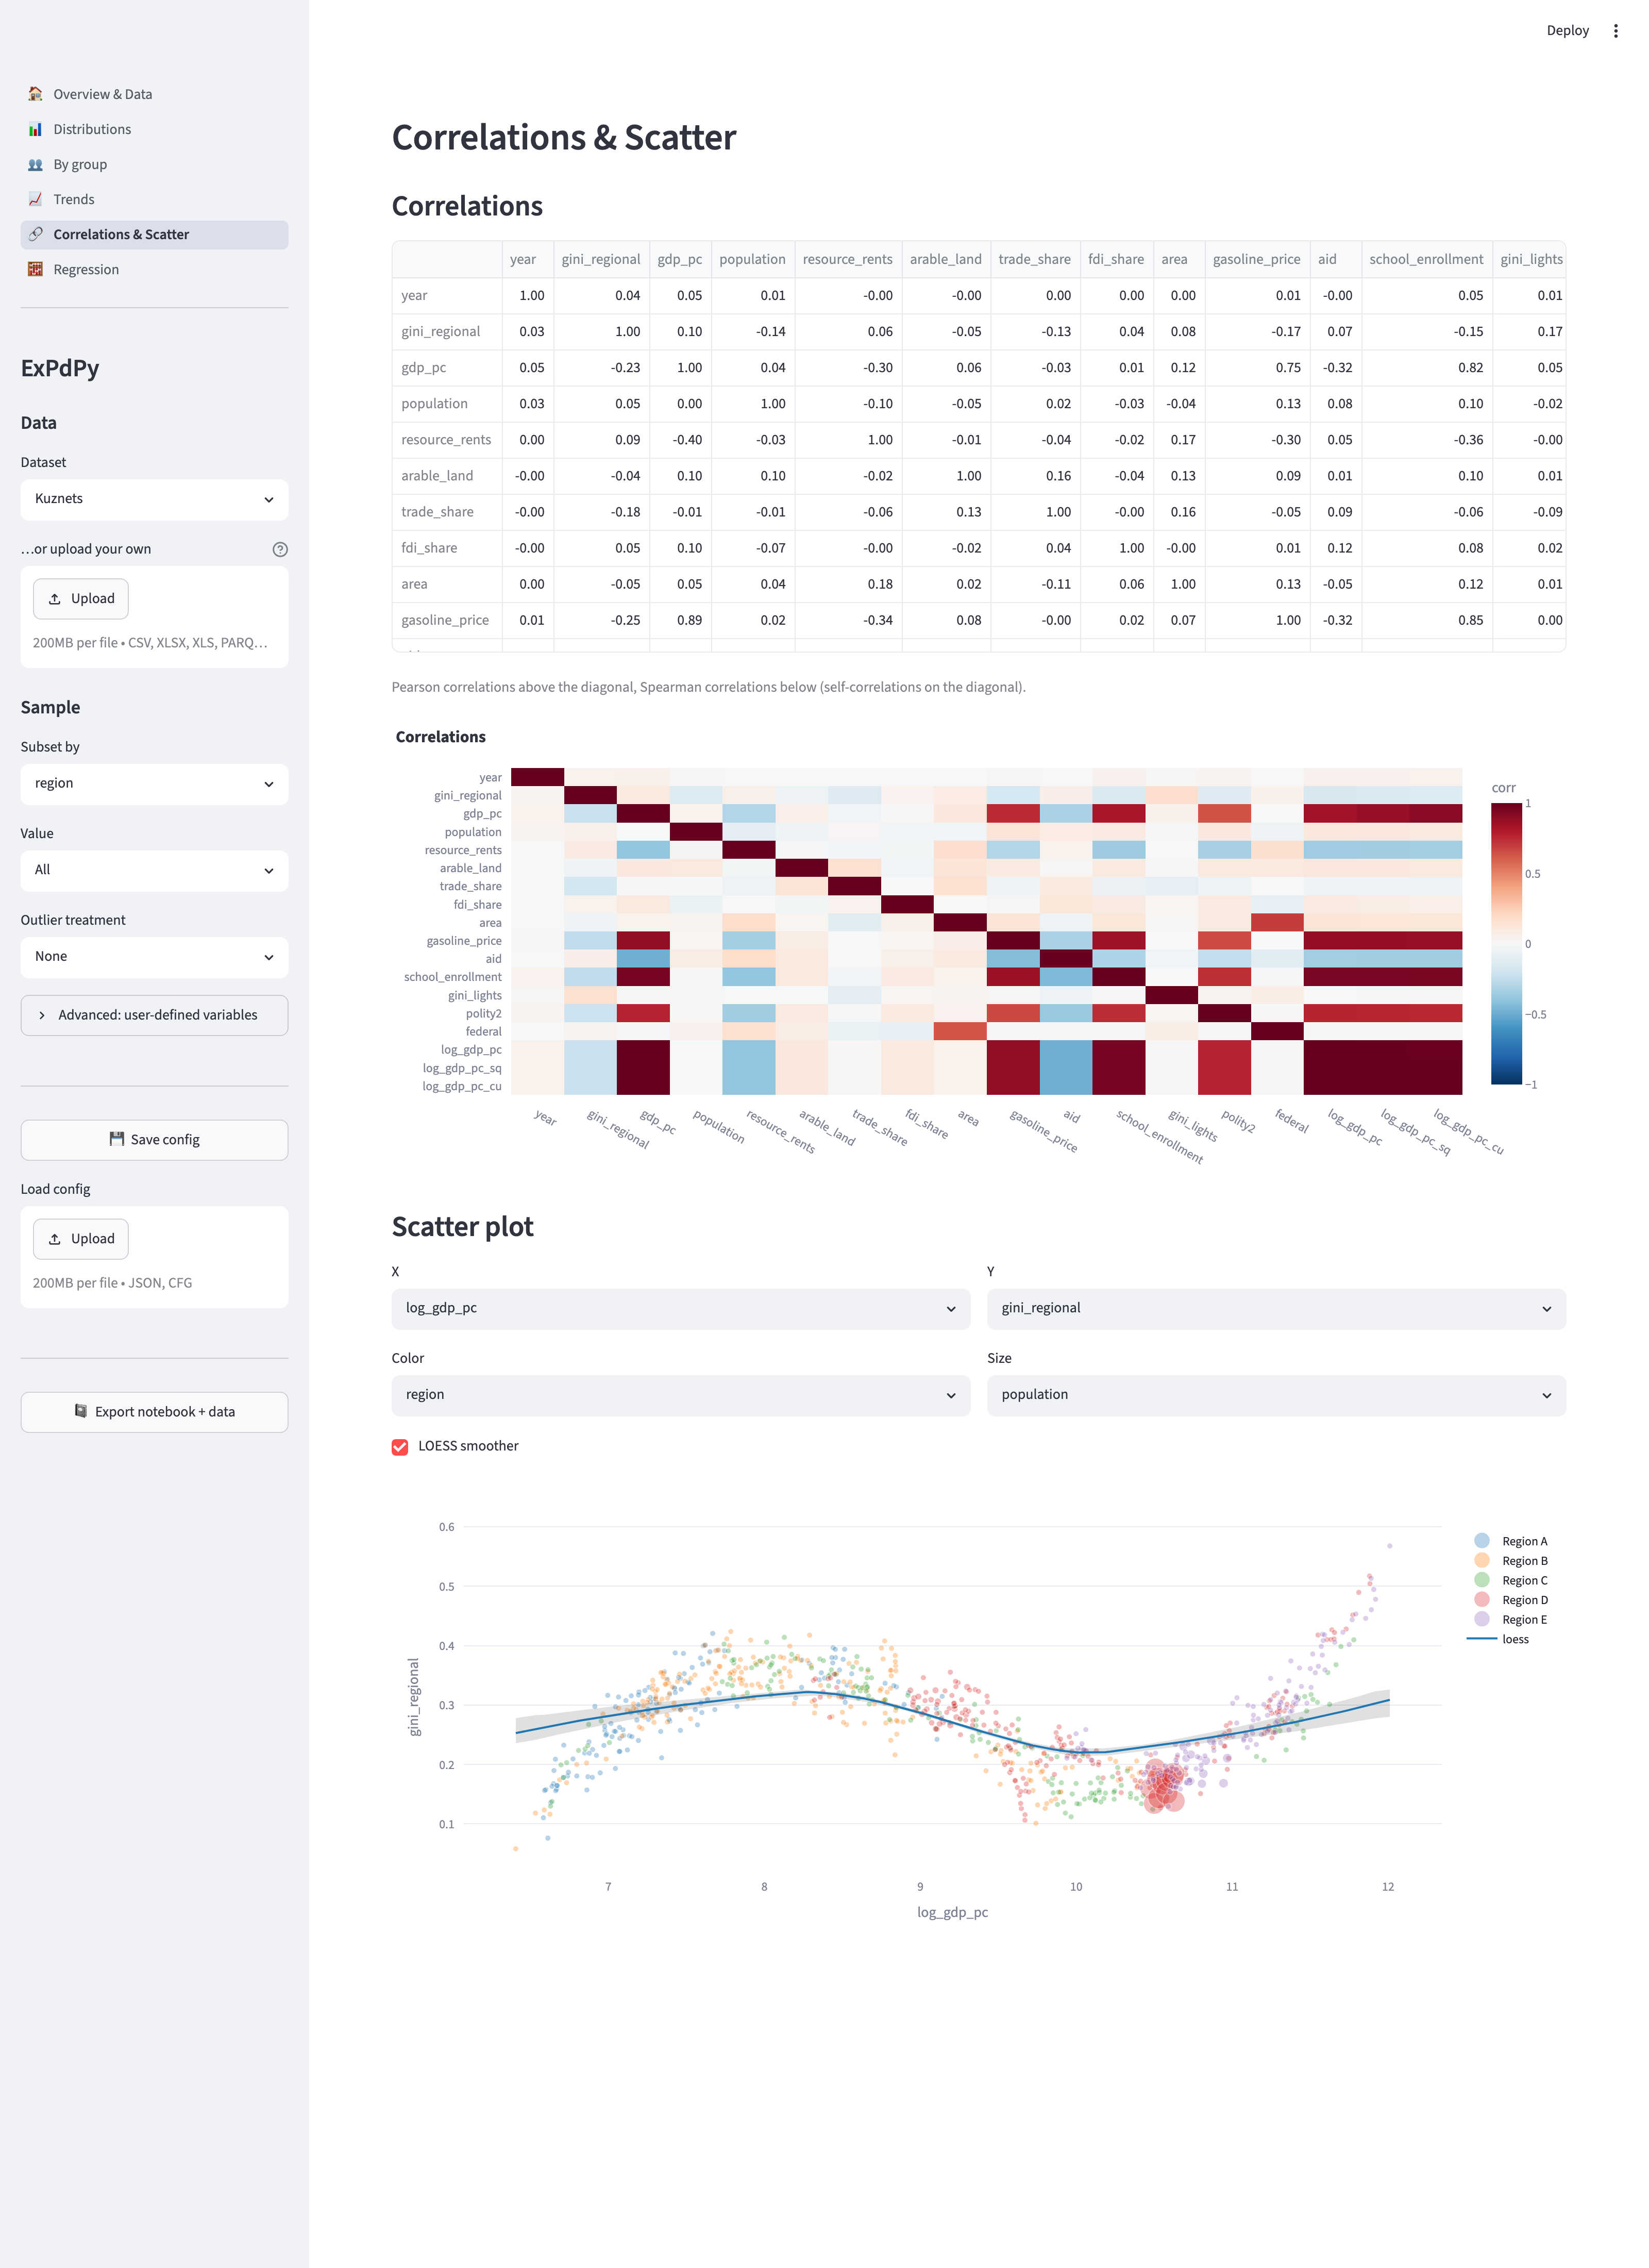
| Correlations & Scatter | correlation table + heatmap, scatter with color/size/LOESS |
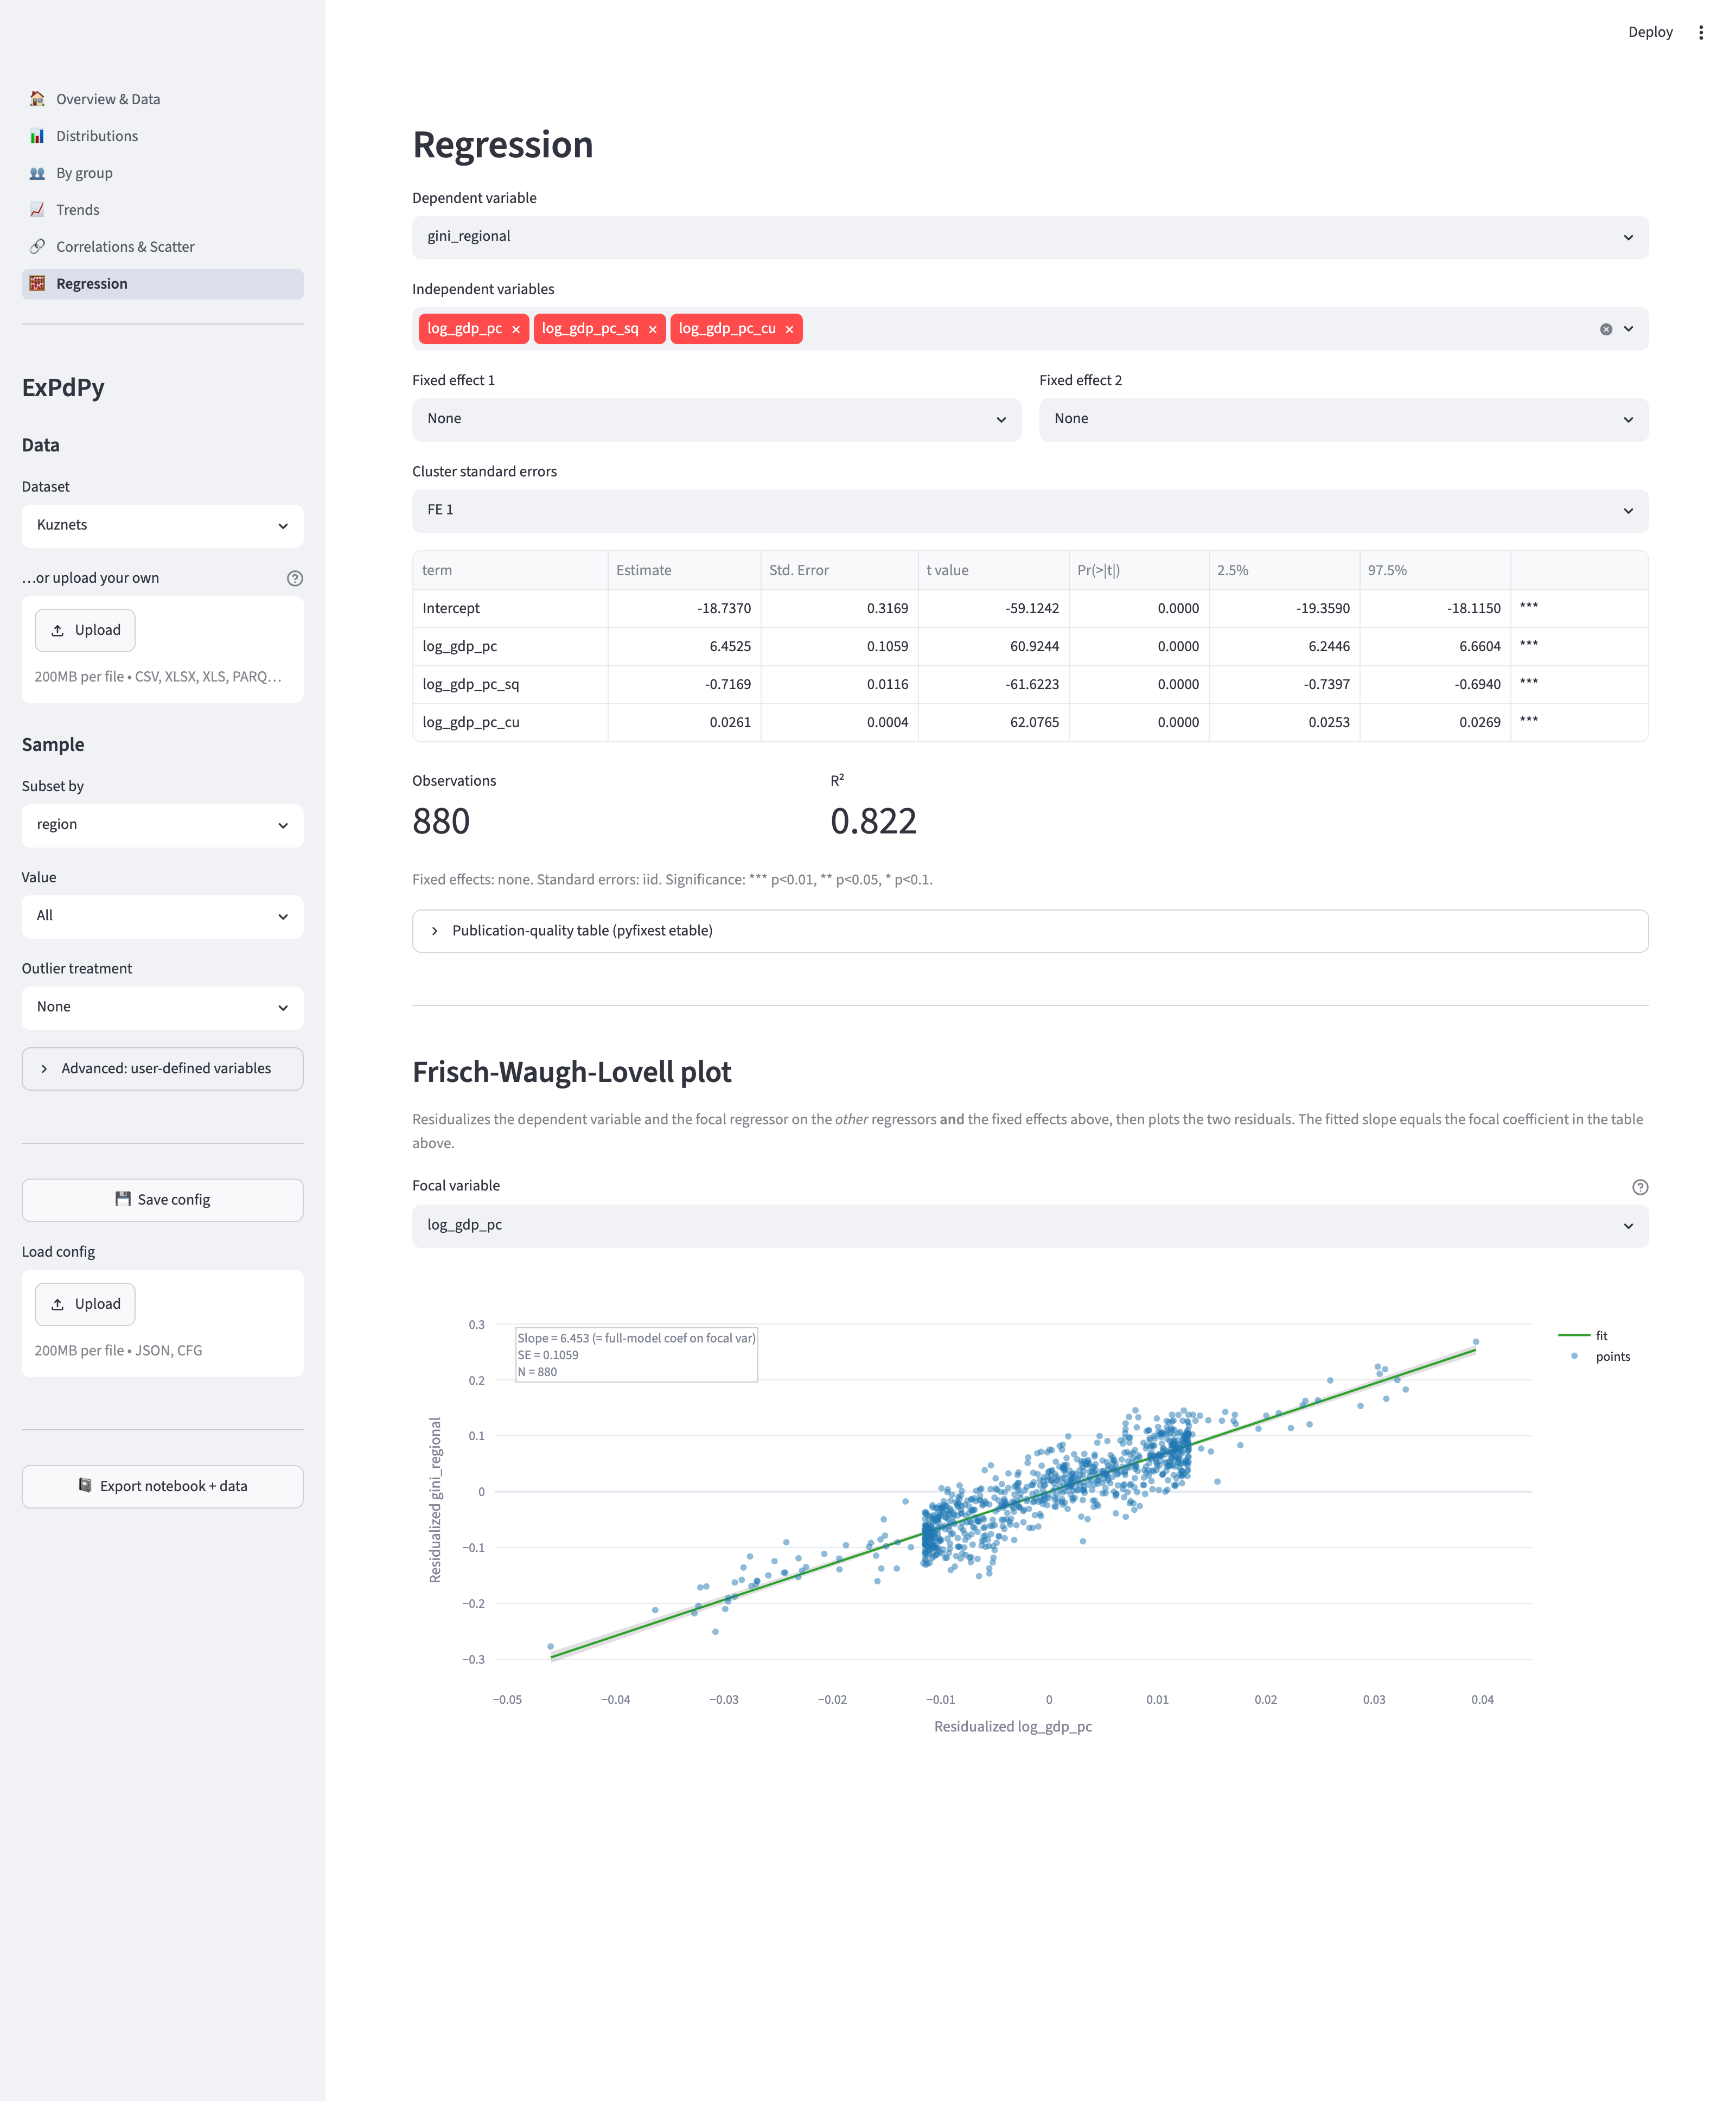
| Regression | OLS with fixed effects and clustered standard errors |
Time-series pages and components (Trends, missing values, by-group trend) are hidden automatically for cross-sectional data — exactly as in the Shiny app.
The dataset picker and upload
Launched without data — or deployed to the Cloud — the app starts with a dataset picker (defaulting to Kuznets; also Gapminder) and a file uploader. An uploaded CSV / Excel / Parquet file overrides the selected dataset:
from expdpy.streamlit_app import ExPdPy

ExPdPy()  # bundled-dataset picker + upload box
Cross-sectional data
Omit the time-series identifier and the time-trend pages/components disappear:
ExPdPy(load_kuznets().query("year == 2025")) # no ts_id -> cross-sectionalThe sample pipeline
The sidebar’s Subset by / Value selectors restrict the sample to one level of a factor, and Outlier treatment winsorizes or truncates the numeric columns at the 1st/99th or 5th/95th percentile. Every component downstream reflects the prepared sample.
User-defined variables
Expand Advanced: user-defined variables to compute new variables from the base data with safe expressions (column references plus + - * / ** %, comparisons, & |, and the functions isna, exp, log, lag, lead; lag/lead are panel-aware). When any row is filled, the analysis runs on the defined variables.
Expressions are evaluated with a restricted AST walker — never eval/exec — shared with the Shiny app, so configurations are interchangeable between the two apps.
Saving configurations and reproducible export
Save config downloads the current selections as JSON; Load config restores them. The format is identical to the Shiny app’s, so a config saved in one app loads in the other. Export notebook + data downloads a zip with the prepared sample (parquet) plus a Jupyter notebook and a .py script that recreate every displayed component with expdpy calls.
Deploying on Streamlit Community Cloud
The repository ships a thin entry script, streamlit_app.py, that the Cloud points at (or run it locally):
streamlit run streamlit_app.pyOn Streamlit Community Cloud, set the app’s main file to streamlit_app.py and add expdpy (with the streamlit extra) to the environment. The app starts with the dataset picker and upload box — no code required.
Upload size is capped by .streamlit/config.toml ([server] maxUploadSize, default 200 MB). Increase it there, or pass max_upload_size= to ExPdPy(...) for a local run.
Customizing the app
The Streamlit ExPdPy launcher takes the same customization arguments as the Shiny version — only the import path differs (from expdpy.streamlit_app import ExPdPy).
Selecting components
components controls which analysis components appear (and seeds page selection). Pass a list or a {name: bool} mapping:
from expdpy.streamlit_app import ExPdPy
from expdpy.data import load_kuznets, load_kuznets_data_def

ExPdPy(
    load_kuznets(),
    df_def=load_kuznets_data_def(),
    components=["descriptive_table", "scatter_plot", "regression"],
)
The available component names are:
bar_chart, missing_values, descriptive_table, histogram, ext_obs, by_group_bar_graph, by_group_violin_graph, trend_graph, quantile_trend_graph, by_group_trend_graph, corrplot, scatter_plot, regression.
A navigation page is shown only when at least one of its components is active, and time-series components are dropped for cross-sectional data — so disabling components can remove whole pages from the menu.
Advanced mode — building analysis variables
Provide a var_def frame (or fill the sidebar’s Advanced: user-defined variables editor) to compute the analysis sample from the base data. Each var_def is a safe expression (isna, exp, log, lag, lead, arithmetic, comparisons, & |); lag/lead shift within cs_id groups ordered by ts_id.
import pandas as pd
from expdpy.streamlit_app import ExPdPy
from expdpy.data import load_kuznets, load_kuznets_data_def

var_def = pd.DataFrame(
    {
        "var_name": ["country", "year", "gdp_pc_growth"],
        "var_def": ["country", "year", "(gdp_pc - lag(gdp_pc, 1)) / lag(gdp_pc, 1)"],
        "type": ["cs_id", "ts_id", "numeric"],
        "can_be_na": [False, False, True],
    }
)
ExPdPy(load_kuznets(), df_def=load_kuznets_data_def(), var_def=var_def)
Disabling features and server options
ExPdPy(
    load_kuznets(),
    df_def=load_kuznets_data_def(),
    export_nb_option=False,      # hide notebook export
    save_settings_option=False,  # hide config save/load
    headless=True,               # forwarded to `streamlit run --server.headless true`
    port=8765,                   # `--server.port 8765`
)
Server-style keyword arguments (port, host, headless, max_upload_size, …) are mapped to the corresponding streamlit run --server.* flags. Pass run=False to get the command list back without launching (useful in tests).